

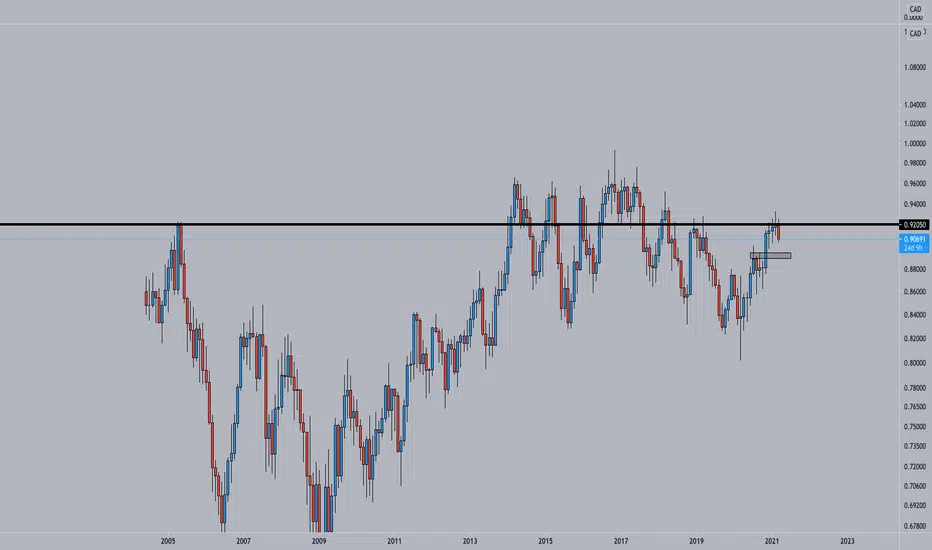
On the Monthly chart you can clearly see that we are sitting in a Supply & Demand region, acting as resistance.
This is a zone where our main bias will always be short.
You can see what this zone has triggered in the past.
Also we have received a solid bearish candle on the Monthly chart.
These are indications for a possible short set-up.
This is a zone where our main bias will always be short.
You can see what this zone has triggered in the past.
Also we have received a solid bearish candle on the Monthly chart.
These are indications for a possible short set-up.
注释
On the Weekly chart, you can see we were making HHs and HLs. This was pretty corrective price action (with the trend) as you can see.
This is an indication that the bears are gaining power.
We have received multiple Weekly Fib completions.
We have received a break of the ascending trend (line) and the last HL.
These were also indications for a short set-up.
注释
On the Daily chart, you can also see that we broke the ascending trend (line) and the last HL. We have received a solid bearish impulse to the downside.
We do expect a Bearish W pattern as confirmation.
My entry would be around the white box region as this is a very clear Supply & Demand zone.
On the 4H i will determine my precise entry if we do receive a Daily pattern first.

免责声明
这些信息和出版物并非旨在提供,也不构成TradingView提供或认可的任何形式的财务、投资、交易或其他类型的建议或推荐。请阅读使用条款了解更多信息。