

NZD/CAD:SELL From 61.8% FIBO Resistance AREA DIV RSI SHORT
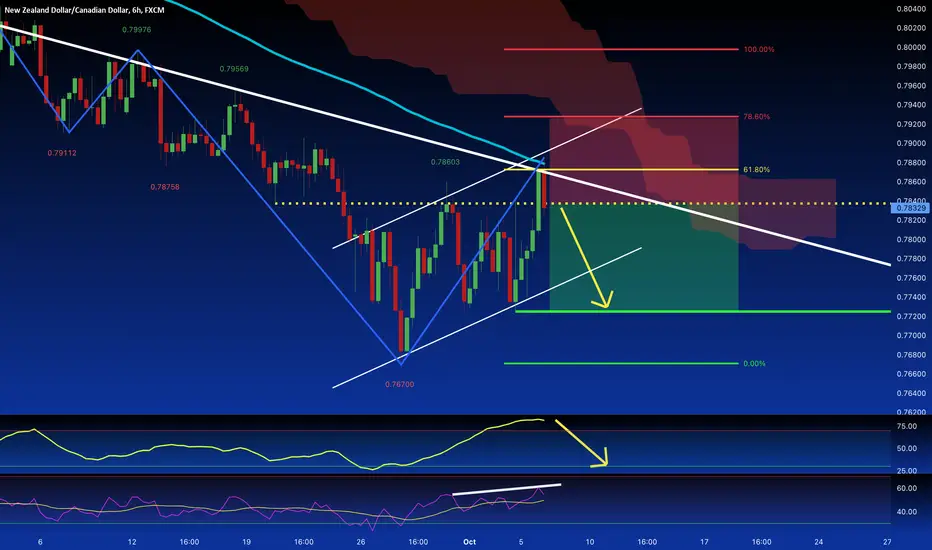
NZD/CAD comes from a solid bearish trend, in the last sessions, the price had a retracement to the 61.8% Fibonacci retracement whereas today the market opened with a strong bearish candle. At this price, the level is placed some static resistance and the dynamic trendline. The 100 Moving average had worked like a rebound point where the candle turned bearish and the indicators, the RSI ( in divergence ), and the Stochastic show a drop-down pattern.
注释

免责声明
这些信息和出版物并非旨在提供,也不构成TradingView提供或认可的任何形式的财务、投资、交易或其他类型的建议或推荐。请阅读使用条款了解更多信息。