

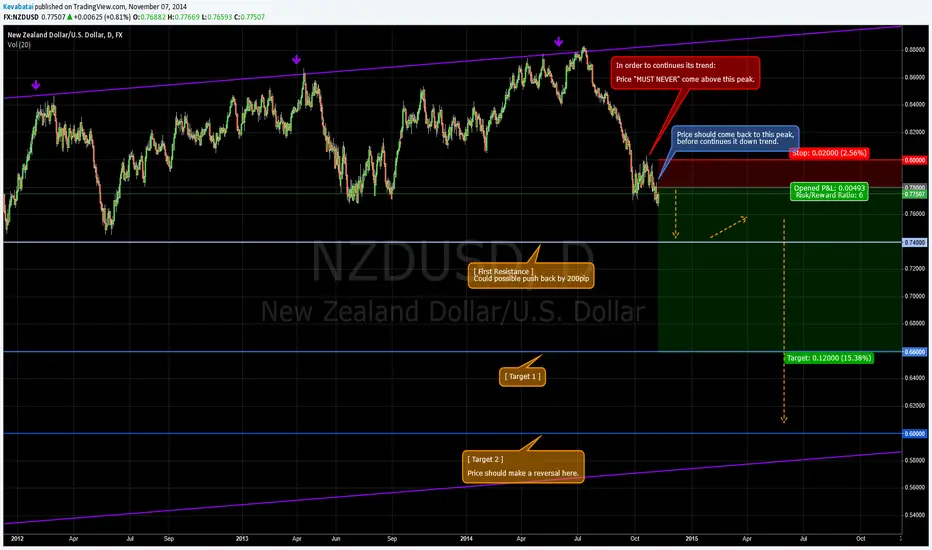
This setup is base on the following price confluences.
1. Downtrend on Monthly chart wish has been initiated from a double top @ 0.8800
2. Support and Resistance lines for a very long expectation of down trend.
3. Fibonacci Pivots Points (Yearly) of S1, @ 0.78154 for resistance.
Setup configuration :: (More info with a bigger views in the follow up monthly chart.)
[ SHORT @ 0.7800 ] (As point by Blue box)
This number come from many previous days, as well as during the last week. Including, this number also located approximately right at Fibonacci Pivots Points (Yearly) of S1.
[ STOP @ 0.8000 ] (As point by RED box)
This number come from the last peak, and numeral smaller peak under its. Thus, it shown some sign of price rejection under this numbers.
[ TARGET 1 @ 0.6600 ]
This number come from year 2010 rejection and several years before it. (As pointed by many small blue arrow)
1. Downtrend on Monthly chart wish has been initiated from a double top @ 0.8800
2. Support and Resistance lines for a very long expectation of down trend.
3. Fibonacci Pivots Points (Yearly) of S1, @ 0.78154 for resistance.
Setup configuration :: (More info with a bigger views in the follow up monthly chart.)
[ SHORT @ 0.7800 ] (As point by Blue box)
This number come from many previous days, as well as during the last week. Including, this number also located approximately right at Fibonacci Pivots Points (Yearly) of S1.
[ STOP @ 0.8000 ] (As point by RED box)
This number come from the last peak, and numeral smaller peak under its. Thus, it shown some sign of price rejection under this numbers.
[ TARGET 1 @ 0.6600 ]
This number come from year 2010 rejection and several years before it. (As pointed by many small blue arrow)

免责声明
这些信息和出版物并非旨在提供,也不构成TradingView提供或认可的任何形式的财务、投资、交易或其他类型的建议或推荐。请阅读使用条款了解更多信息。