做多
OGN Price Prediction
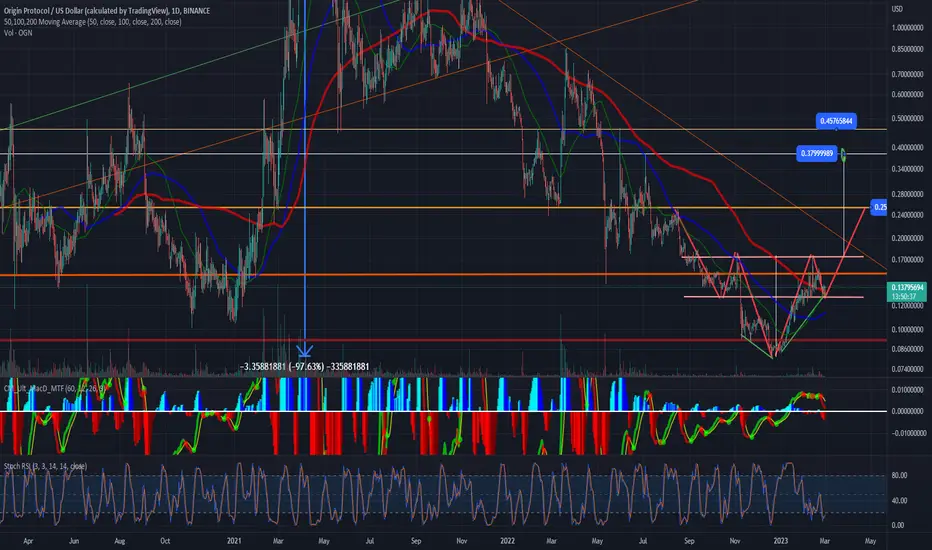
OGN price, forming reversal head and shoulder pattern, which the formation it might ends in the middle of march.
Then we can see, bounce from the lows of 0.13 cents until 0.25 cents for the begining of an upside leg.
If we stay above the 0.25 cents as support, we then can see more upside legs froming until 0.37 ~ 0.45 as you can see in the chart.
RSI remaining fro the time being, near oversold area.
This can be good time to buy!
Then we can see, bounce from the lows of 0.13 cents until 0.25 cents for the begining of an upside leg.
If we stay above the 0.25 cents as support, we then can see more upside legs froming until 0.37 ~ 0.45 as you can see in the chart.
RSI remaining fro the time being, near oversold area.
This can be good time to buy!

免责声明
这些信息和出版物并非旨在提供,也不构成TradingView提供或认可的任何形式的财务、投资、交易或其他类型的建议或推荐。请阅读使用条款了解更多信息。