
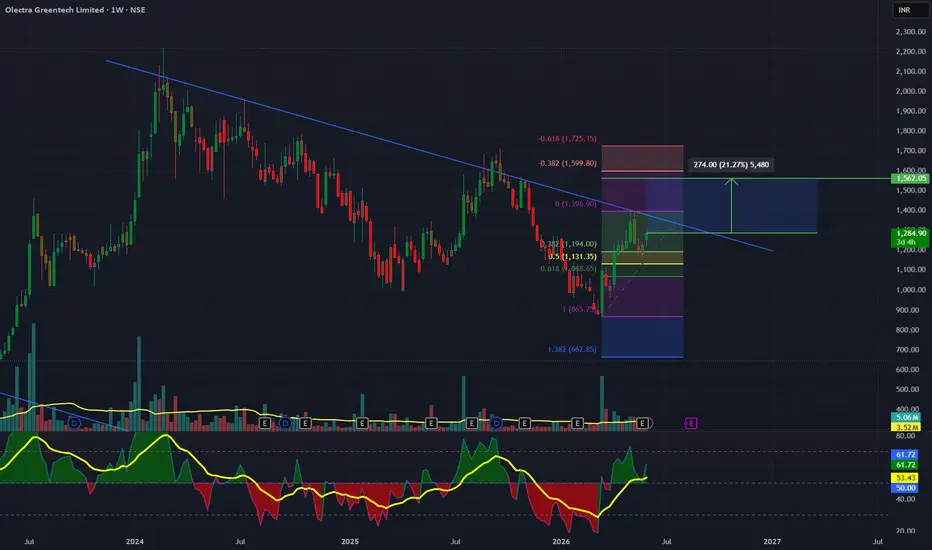
OLECTRA is approaching a decisive technical juncture on the weekly timeframe. After correcting nearly 60% from its peak, the stock has established a strong accumulation base and is now challenging a long-term descending resistance line.
The recent rally from the ₹865 demand zone demonstrates renewed buying interest and improving market sentiment.
A successful breakout above the trendline and Fibonacci resistance cluster could trigger a fresh medium-term uptrend.
Key Levels:
Current Price: ₹1,287
Immediate Resistance: ₹1,396
Major Resistance: ₹1,560
Support Zone: ₹1,130–₹1,070
Major Demand Zone: ₹865
Invalidation Level: Weekly close below ₹1,050
Trade Plan
Aggressive Entry
Near current levels while holding above ₹1,200
Conservative Entry
Weekly close above ₹1,400 with volume confirmation
Targets
🎯 Target 1: ₹1,396
🎯 Target 2: ₹1,560
🎯 Extended Target: ₹1,725
Potential upside from current levels:
~8% to T1
~21% to T2
~34% to extended target
Technical Observations
Descending trendline resistance under pressure
Fibonacci retracement levels acting as roadmap
Momentum oscillator has crossed above the neutral zone
Relative strength improving versus broader market
Recovery rally supported by higher volumes
Weekly structure favors continuation if breakout succeeds
Why This Setup Matters
OLECTRA is a classic example of a stock transitioning from a prolonged correction into a possible accumulation and recovery phase. Breakouts from long-term descending trendlines often attract both positional investors and momentum traders.
A sustained move above ₹1,400 could signal the beginning of a larger trend reversal toward ₹1,560–₹1,725.
Disclaimer
This analysis is for educational purposes only and should not be considered investment advice. Trading and investing in securities involve substantial risk. Always conduct your own research, follow disciplined risk management practices, and consult a qualified financial advisor before making investment decisions.
The recent rally from the ₹865 demand zone demonstrates renewed buying interest and improving market sentiment.
A successful breakout above the trendline and Fibonacci resistance cluster could trigger a fresh medium-term uptrend.
Key Levels:
Current Price: ₹1,287
Immediate Resistance: ₹1,396
Major Resistance: ₹1,560
Support Zone: ₹1,130–₹1,070
Major Demand Zone: ₹865
Invalidation Level: Weekly close below ₹1,050
Trade Plan
Aggressive Entry
Near current levels while holding above ₹1,200
Conservative Entry
Weekly close above ₹1,400 with volume confirmation
Targets
🎯 Target 1: ₹1,396
🎯 Target 2: ₹1,560
🎯 Extended Target: ₹1,725
Potential upside from current levels:
~8% to T1
~21% to T2
~34% to extended target
Technical Observations
Descending trendline resistance under pressure
Fibonacci retracement levels acting as roadmap
Momentum oscillator has crossed above the neutral zone
Relative strength improving versus broader market
Recovery rally supported by higher volumes
Weekly structure favors continuation if breakout succeeds
Why This Setup Matters
OLECTRA is a classic example of a stock transitioning from a prolonged correction into a possible accumulation and recovery phase. Breakouts from long-term descending trendlines often attract both positional investors and momentum traders.
A sustained move above ₹1,400 could signal the beginning of a larger trend reversal toward ₹1,560–₹1,725.
Disclaimer
This analysis is for educational purposes only and should not be considered investment advice. Trading and investing in securities involve substantial risk. Always conduct your own research, follow disciplined risk management practices, and consult a qualified financial advisor before making investment decisions.
交易结束:到达目标
1552 20% target hit, now not waiting for more. markets are still choppy. Trade closed. Exited!
免责声明
这些信息和出版物并非旨在提供,也不构成TradingView提供或认可的任何形式的财务、投资、交易或其他类型的建议或推荐。请阅读使用条款了解更多信息。
免责声明
这些信息和出版物并非旨在提供,也不构成TradingView提供或认可的任何形式的财务、投资、交易或其他类型的建议或推荐。请阅读使用条款了解更多信息。