
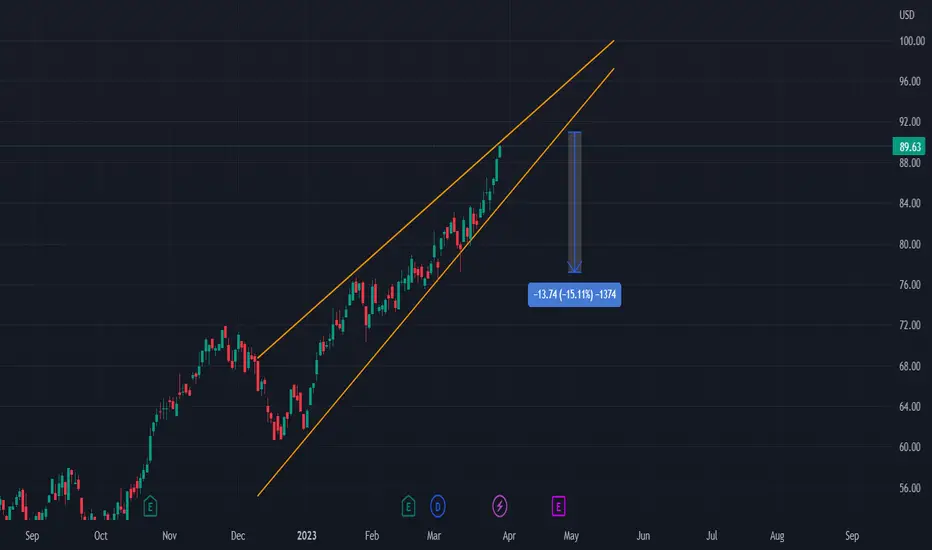
On the chart, we can see a rising wedge occurring.
OMAB is at its 52-week high, and this has been formed as a rising wedge.
We therefore expect it to have a drop to the downside.
Entry will be at the breakout of the wedge with a possible ROI of 15%
More details are shown on the chart.
OMAB is at its 52-week high, and this has been formed as a rising wedge.
We therefore expect it to have a drop to the downside.
Entry will be at the breakout of the wedge with a possible ROI of 15%
More details are shown on the chart.
交易结束:到达目标
Played out as expected. Closing here as target reached almost.注释
Next Short may be entered on the retest of the upsloping resistance (previous support)注释
have bounced
💥 Free signals and ideas ➡ t.me/vfinvestment
相关出版物
免责声明
这些信息和出版物并非旨在提供,也不构成TradingView提供或认可的任何形式的财务、投资、交易或其他类型的建议或推荐。请阅读使用条款了解更多信息。
💥 Free signals and ideas ➡ t.me/vfinvestment
相关出版物
免责声明
这些信息和出版物并非旨在提供,也不构成TradingView提供或认可的任何形式的财务、投资、交易或其他类型的建议或推荐。请阅读使用条款了解更多信息。