
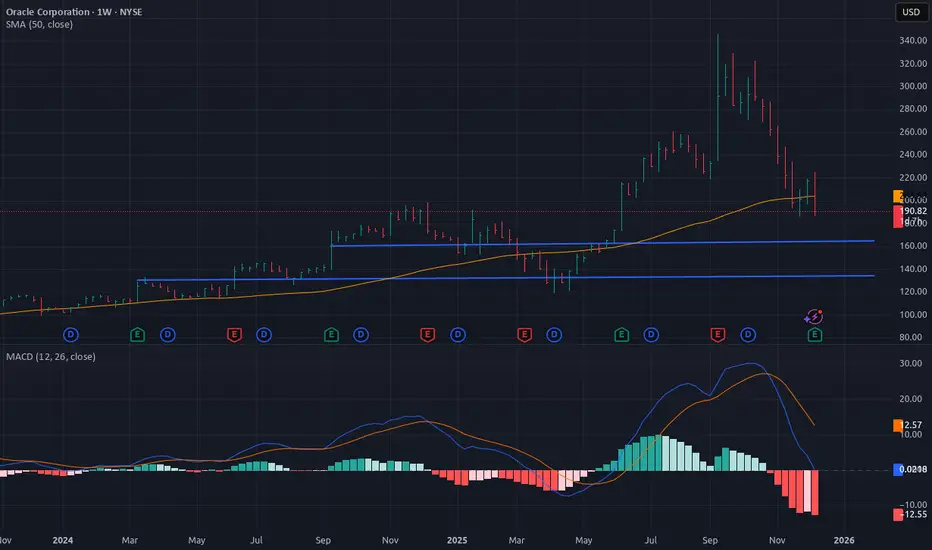
Watch out for Oracle to break the current uptrend on weekly, it's getting weaker along with the distribution on daily which has started about a month ago and still ongoing. The current weekly uptrend is still holding up but it's getting weaker and in danger for a possible downtrend, for now we need more time to see the confirmation.
Watch the blue lines as pivots to hold the support.
Watch the blue lines as pivots to hold the support.
注释
P.S.There are many other indicators that are being used for this TA, the above snapshot is only an example.
Moreover, I've been doing technical analysis for quite some time, and I'm neither bullish nor bearish, I'm a swing trader who likes TA. And as you should know - always make your own choices.

免责声明
这些信息和出版物并非旨在提供,也不构成TradingView提供或认可的任何形式的财务、投资、交易或其他类型的建议或推荐。请阅读使用条款了解更多信息。
免责声明
这些信息和出版物并非旨在提供,也不构成TradingView提供或认可的任何形式的财务、投资、交易或其他类型的建议或推荐。请阅读使用条款了解更多信息。