
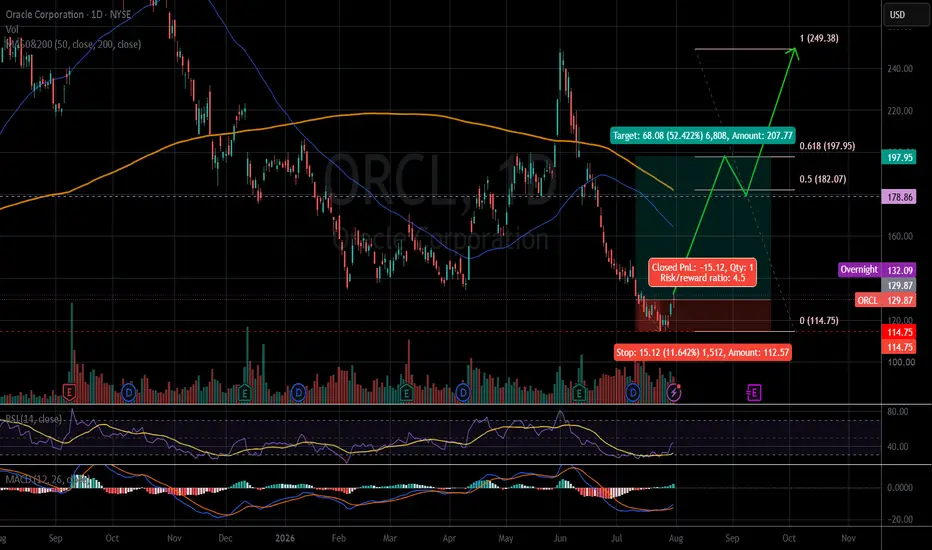
The weekly chart shows a bullish divergence with the RSI.
There were signs of a price increase last week, according to the RSI and MACD indicators.
The price closed on 07.31.2026: $129.87.
Price target: $197.95/ $249.38
Stop loss: $114.75 (-11.6%)
R/R: 4.5
IMO, amateur trader.
Good luck!
There were signs of a price increase last week, according to the RSI and MACD indicators.
The price closed on 07.31.2026: $129.87.
Price target: $197.95/ $249.38
Stop loss: $114.75 (-11.6%)
R/R: 4.5
IMO, amateur trader.
Good luck!

免责声明
这些信息和出版物并非旨在提供,也不构成TradingView提供或认可的任何形式的财务、投资、交易或其他类型的建议或推荐。请阅读使用条款了解更多信息。