
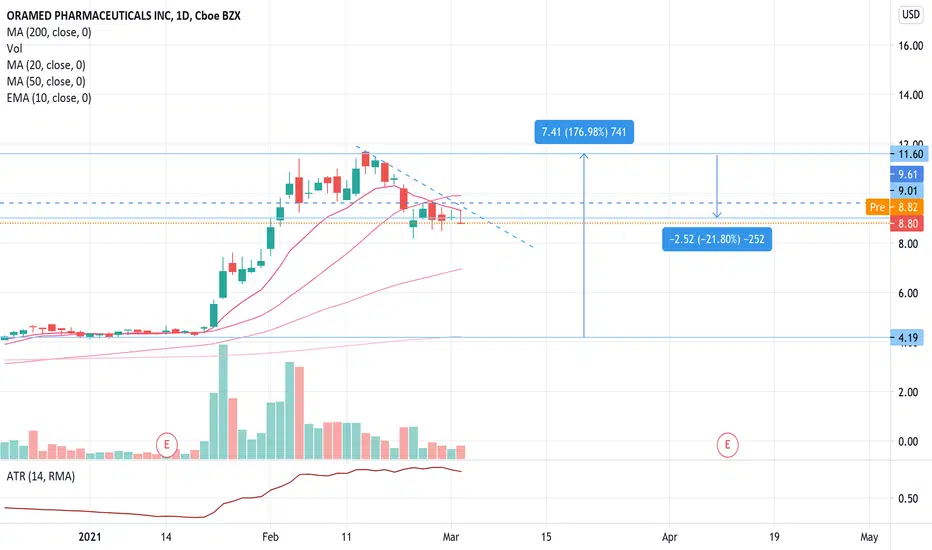
High tight flag chart pattern forms when a stock rises over 90% (preferably 100%) or more in two months, then consolidates sideways for 15-25 days with a decline of no more than 25%. When there's a breakout of the sideways 'flag' on high volume , the powerful uptrend often resumes.
The entry point is either as the stock breaks the high of the flag or breaks a downtrend line - but only ever on higher than average volume.
Looking for an entry if it breaks back above the moving average lines on higher than average volume. ATR and volume declining recently is a good sign.
The entry point is either as the stock breaks the high of the flag or breaks a downtrend line - but only ever on higher than average volume.
Looking for an entry if it breaks back above the moving average lines on higher than average volume. ATR and volume declining recently is a good sign.

免责声明
这些信息和出版物并非旨在提供,也不构成TradingView提供或认可的任何形式的财务、投资、交易或其他类型的建议或推荐。请阅读使用条款了解更多信息。
免责声明
这些信息和出版物并非旨在提供,也不构成TradingView提供或认可的任何形式的财务、投资、交易或其他类型的建议或推荐。请阅读使用条款了解更多信息。