
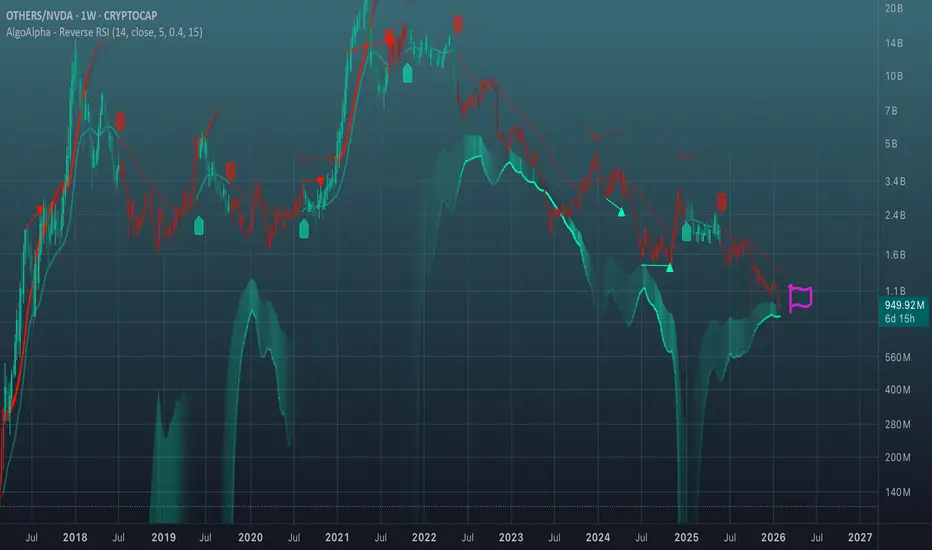
This chart demonstrates exactly the same process that I described in the OTHERS/XAUSD chart. Well, except that there is still a little way to go before it touches the line. While we are looking at the dominance of OTHERS and the dominance of Bitcoin, right now there are two powerful contenders for liquidity flow.
注释
In addition, let's consider 1M using Polynomial Regression Channel
and Price Heat Meter (both from ChartPrime).
The monthly regression channel shows a return of the aggressive
upward channel as early as March-April. The candlestick may
bounce right off it. The Price Heat Meter shows the formation of
Lower extremes print an aqua % label (possible exhaustion/support context).
But one such support has already been broken, so the one that is forming now should work.
注释

免责声明
这些信息和出版物并非旨在提供,也不构成TradingView提供或认可的任何形式的财务、投资、交易或其他类型的建议或推荐。请阅读使用条款了解更多信息。
免责声明
这些信息和出版物并非旨在提供,也不构成TradingView提供或认可的任何形式的财务、投资、交易或其他类型的建议或推荐。请阅读使用条款了解更多信息。