
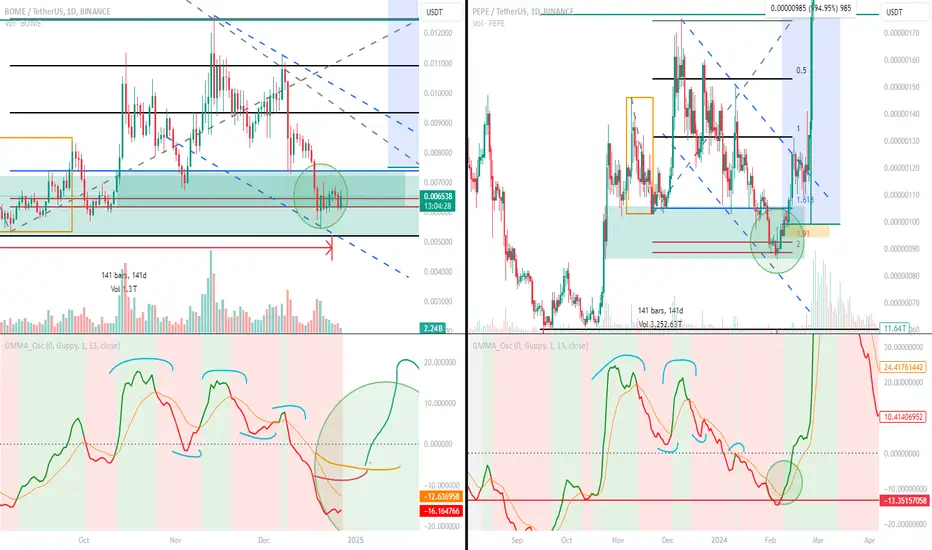
In today’s update, I would like to discuss the comparison of GMMA indicator behavior on BOME in relation to what the GMMA indicator showed in the past on PEPE.
The comparative analysis revealed that on both PEPE and BOME:
We observe a local peak both in the price and on the GMMA indicator (the first blue drawn line on both GMMA indicators).
A local trough both in the price and on the GMMA indicator (the second blue drawn line on both GMMA indicators).
A local peak in the price and a peak on the GMMA indicator (the third blue drawn line on both GMMA indicators) – the peak on the indicator is lower than the previous peak marked in step one.
A local trough in the price and a trough on the GMMA indicator (the fourth blue drawn line on both GMMA indicators) – the trough on the indicator is higher than the previous peak marked in step one.
An upward move on the indicator to the orange average and a temporary shift to green, followed shortly by another significant drop below the orange average.
On PEPE, in step 6, we observe the final breakout above the orange average and the indicator turning green. This point was a high-quality moment to invest in PEPE.
On BOME, I anticipate a similar breakout above the orange average on the indicator and a color change from red to green.
From this point, dynamic increases should begin, reaching up to the 261.8 level measured from the global decline (from the March peak to the August trough).
The 261.8 level is around $0.068–$0.069.
Currently, BOME is consolidating around the maximum range of the corrective move driving the uptrend. It looks like an accumulation phase before a potential dynamic increase
The comparative analysis revealed that on both PEPE and BOME:
We observe a local peak both in the price and on the GMMA indicator (the first blue drawn line on both GMMA indicators).
A local trough both in the price and on the GMMA indicator (the second blue drawn line on both GMMA indicators).
A local peak in the price and a peak on the GMMA indicator (the third blue drawn line on both GMMA indicators) – the peak on the indicator is lower than the previous peak marked in step one.
A local trough in the price and a trough on the GMMA indicator (the fourth blue drawn line on both GMMA indicators) – the trough on the indicator is higher than the previous peak marked in step one.
An upward move on the indicator to the orange average and a temporary shift to green, followed shortly by another significant drop below the orange average.
On PEPE, in step 6, we observe the final breakout above the orange average and the indicator turning green. This point was a high-quality moment to invest in PEPE.
On BOME, I anticipate a similar breakout above the orange average on the indicator and a color change from red to green.
From this point, dynamic increases should begin, reaching up to the 261.8 level measured from the global decline (from the March peak to the August trough).
The 261.8 level is around $0.068–$0.069.
Currently, BOME is consolidating around the maximum range of the corrective move driving the uptrend. It looks like an accumulation phase before a potential dynamic increase
交易开始
The GMMA indicator on the 1D timeframe turned green today.According to the analysis, if today's 1D candle closes and the GMMA indicator remains green, there is a high probability that an upward rally is starting.
Link to analysis where GMMA indicators turned green:
交易结束:到达目标
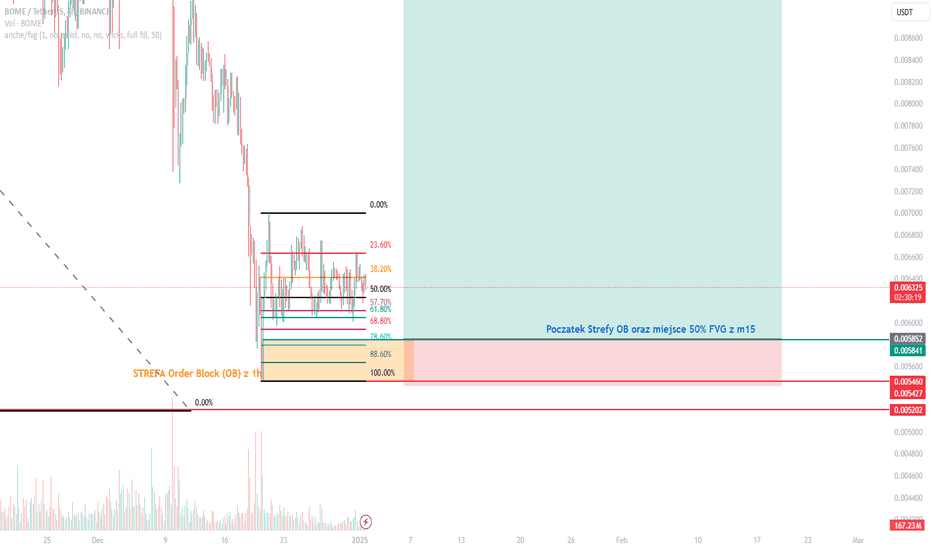
Although the upward movement has already started following the GMMA indicator turning green, I do not rule out a drop to the 0.0058-0.0059 range, where we have an unfilled FVG. As we know, Smart Money tends to fill unfulfilled orders before initiating strong upward moves.If the price drops to these levels, I will be looking for a long position as outlined in the idea below:

免责声明
这些信息和出版物并非旨在提供,也不构成TradingView提供或认可的任何形式的财务、投资、交易或其他类型的建议或推荐。请阅读使用条款了解更多信息。
免责声明
这些信息和出版物并非旨在提供,也不构成TradingView提供或认可的任何形式的财务、投资、交易或其他类型的建议或推荐。请阅读使用条款了解更多信息。