 PFG
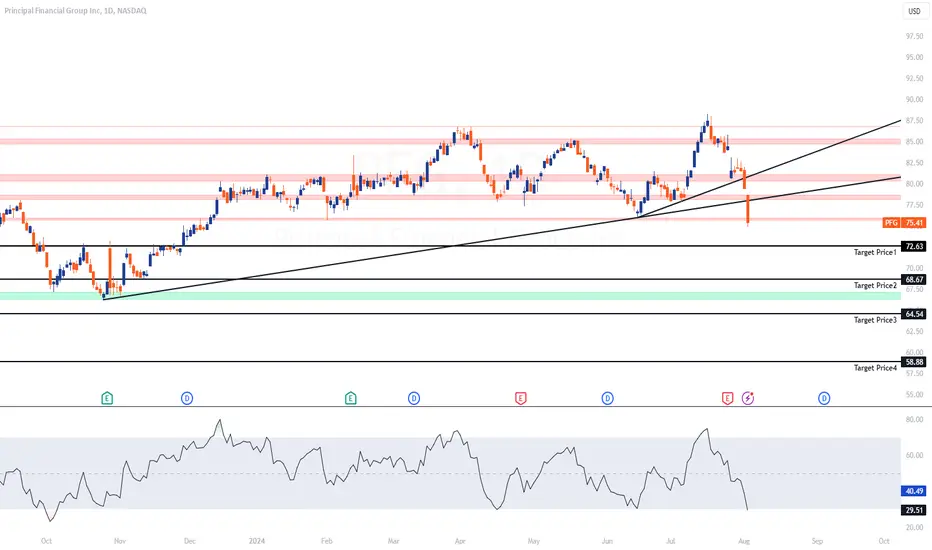
PFG Technical Analysis of Principal Financial Group Inc (PFG)
Key Observations:
Current Price Action:
Price: $75.41
Recent Drop: -4.05 (-5.10%)
Support and Resistance Levels:
Immediate Support: $72.63 (Target Price 1)
Further Supports: $68.67 (Target Price 2), $64.54 (Target Price 3), and $58.88 (Target Price 4)
Resistance: The price has broken below several support levels indicating potential further downside.
Trendlines:
The price has broken below a key upward trendline, signaling a potential shift from a bullish to a bearish trend.
Relative Strength Index (RSI):
Current RSI: 40.49
The RSI is nearing the oversold zone, indicating increasing selling pressure and potential for further declines.
Target Prices:
Target Price 1: $72.63
This level is the immediate support and a potential first target for any continued downward movement.
Target Price 2: $68.67
If the price breaks below the immediate support, the next target is around $68.67, a previous support level.
Target Price 3: $64.54
Further downside could see the price reaching $64.54, another key support level.
Target Price 4: $58.88
In a more bearish scenario, the price could fall to $58.88, a significant support level.
Summary:
Principal Financial Group Inc (PFG) has experienced a significant drop, breaking below several key support levels and its upward trendline. The next levels to watch are $72.63, $68.67, $64.54, and $58.88. The RSI indicates potential for further declines if market conditions remain negative.
交易结束:到达目标

免责声明
这些信息和出版物并非旨在提供,也不构成TradingView提供或认可的任何形式的财务、投资、交易或其他类型的建议或推荐。请阅读使用条款了解更多信息。