
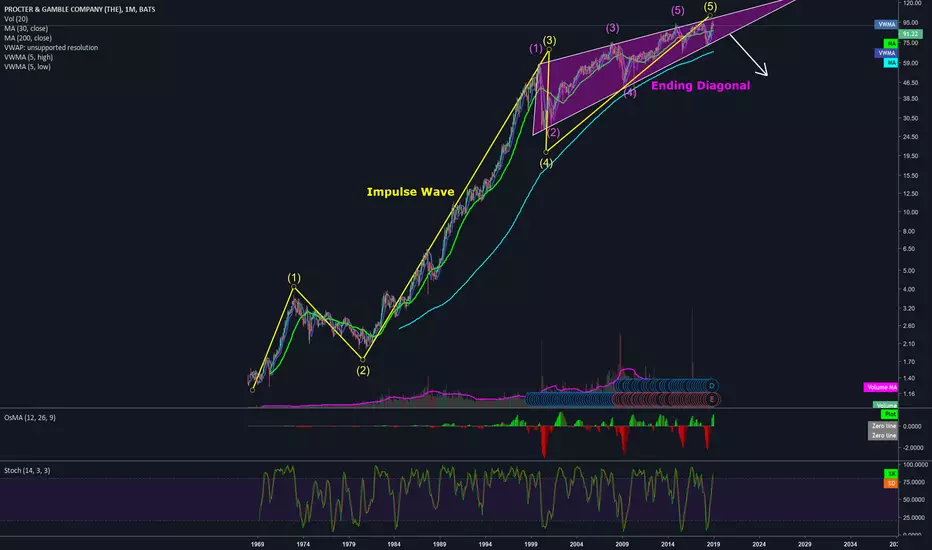
Above is an Elliot Wave analysis using the monthly log chart of P&G.
1. The yellow wave is an impulse wave. You'll see we're at the end of wave 5 of this impulse wave.
2. The purple wave shows that we're at the end of wave 5 inside of an ending diagonal (Rising Wedge) pattern.
A good short entry would be on the retest of the break of the rising wedge pattern (when the price revisits the bottom of the rising wedge pattern and confirms that it is resistance). As of the time I am creating this idea, the price is currently still within the pattern.
1. The yellow wave is an impulse wave. You'll see we're at the end of wave 5 of this impulse wave.
2. The purple wave shows that we're at the end of wave 5 inside of an ending diagonal (Rising Wedge) pattern.
A good short entry would be on the retest of the break of the rising wedge pattern (when the price revisits the bottom of the rising wedge pattern and confirms that it is resistance). As of the time I am creating this idea, the price is currently still within the pattern.
注释
Still waiting for wedge to be violated to the downside and then a clear retest before entering...
My goal is to find the best risk:reward setups. For instance, if you risk $1,000 at a chance to make $5,000, you can afford to be wrong 4 out of 5 times and still not lose money. I hit my targets over 50% of the time.
免责声明
这些信息和出版物并非旨在提供,也不构成TradingView提供或认可的任何形式的财务、投资、交易或其他类型的建议或推荐。请阅读使用条款了解更多信息。
My goal is to find the best risk:reward setups. For instance, if you risk $1,000 at a chance to make $5,000, you can afford to be wrong 4 out of 5 times and still not lose money. I hit my targets over 50% of the time.
免责声明
这些信息和出版物并非旨在提供,也不构成TradingView提供或认可的任何形式的财务、投资、交易或其他类型的建议或推荐。请阅读使用条款了解更多信息。