
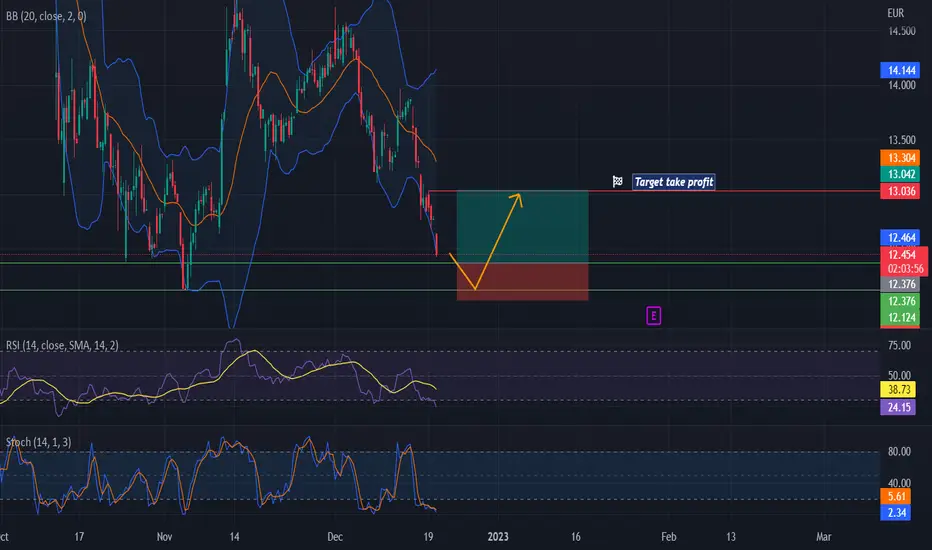
On the Philips chart (PHIA - 4h timeframe), We can see the price is currently oversold. The price is approaching a support area and is probably going to bounce off. Enter and leave the trade at the level defined on the chart.
The three indicators used are Bollinger Bands, RSI, and Stochastics. All these three indicators are confirming the oversold condition.
See all further details on the chart.
Good luck!
The three indicators used are Bollinger Bands, RSI, and Stochastics. All these three indicators are confirming the oversold condition.
See all further details on the chart.
Good luck!
交易结束:到达目标
target reached and overshooted.
💥 Free signals and ideas ➡ t.me/vfinvestment
相关出版物
免责声明
这些信息和出版物并非旨在提供,也不构成TradingView提供或认可的任何形式的财务、投资、交易或其他类型的建议或推荐。请阅读使用条款了解更多信息。
💥 Free signals and ideas ➡ t.me/vfinvestment
相关出版物
免责声明
这些信息和出版物并非旨在提供,也不构成TradingView提供或认可的任何形式的财务、投资、交易或其他类型的建议或推荐。请阅读使用条款了解更多信息。