$PLTR Weekly Chart Double Top Pierce
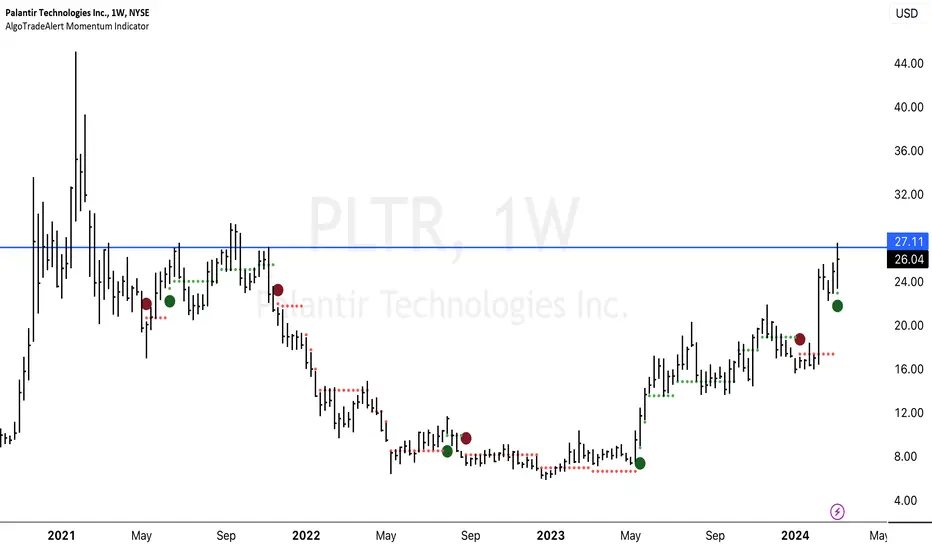
$NYSE:PLTR Weekly Chart Double Top Pierce, to break through this, wait for bullish consolidation.
A "Double Top" in technical analysis refers to a chart pattern that occurs when a security's price forms two consecutive peaks at a similar level, separated by a trough. It typically signifies a potential trend reversal from an uptrend to a downtrend. In the case of the $NYSE:PLTR weekly chart, a Double Top pattern suggests that the stock price of PLTR reached a peak, retraced, and then failed to surpass the previous peak, indicating a possible reversal in the stock's upward momentum. Traders and investors often use this pattern to make decisions about selling or shorting the stock, anticipating further price declines.
A "Double Top" in technical analysis refers to a chart pattern that occurs when a security's price forms two consecutive peaks at a similar level, separated by a trough. It typically signifies a potential trend reversal from an uptrend to a downtrend. In the case of the $NYSE:PLTR weekly chart, a Double Top pattern suggests that the stock price of PLTR reached a peak, retraced, and then failed to surpass the previous peak, indicating a possible reversal in the stock's upward momentum. Traders and investors often use this pattern to make decisions about selling or shorting the stock, anticipating further price declines.

免责声明
这些信息和出版物并非旨在提供,也不构成TradingView提供或认可的任何形式的财务、投资、交易或其他类型的建议或推荐。请阅读使用条款了解更多信息。
免责声明
这些信息和出版物并非旨在提供,也不构成TradingView提供或认可的任何形式的财务、投资、交易或其他类型的建议或推荐。请阅读使用条款了解更多信息。