
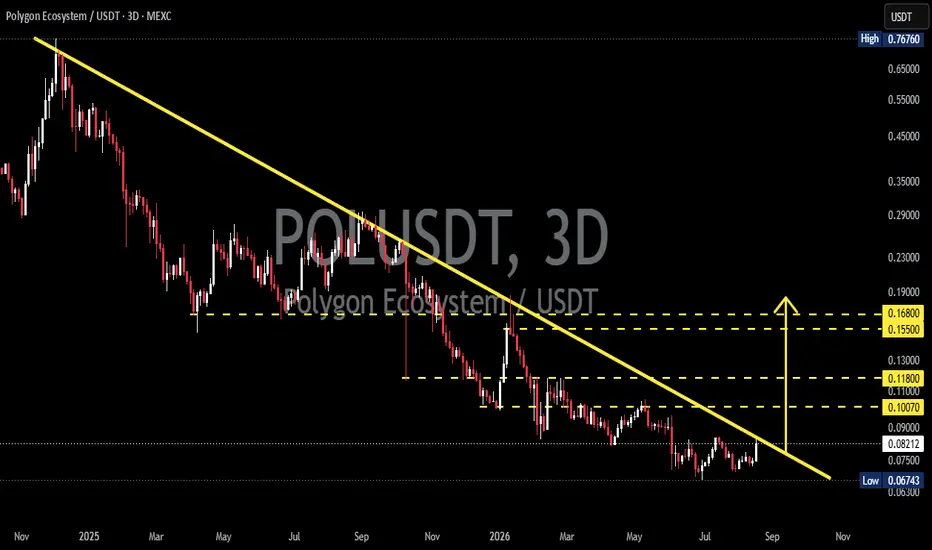
📊 Technical Analysis
💵 Coin: POL / USDT
⌛ Time Frame: 3D
📉 Pattern: Descending Trendline
📍 Current Price: Around $0.08
🟡 Key Support: $0.067 – $0.075
🎯 Key Resistance: $0.1007 – $0.1180
🚀 Major Resistance: $0.1550 – $0.1680
---
📉🔍 Pattern Analysis
POL remains within a long-term bearish structure, with price consistently trading below the descending yellow trendline.
📐 The Descending Trendline has acted as dynamic resistance since the major high around $0.76, repeatedly limiting bullish recovery attempts and contributing to the formation of lower highs.
🔎 However, price is now approaching the trendline again after trading relatively close to the major support area around $0.067–$0.075.
⚠️ This creates an important decision zone:
🟢 A confirmed breakout could signal that the long-term bearish trend is beginning to lose momentum.
🔴 Another rejection could maintain the existing bearish structure and potentially lead to another move lower.
---
🟢🚀 Bullish Scenario
📈 Bullish confirmation would occur ifPOL successfully breaks and closes above the descending trendline.
💥 A confirmed breakout could indicate that the long-term bearish trend is weakening and potentially open the way toward the next resistance zones:
🎯 Target 1: $0.1007
🎯 Target 2: $0.1100
🎯 Target 3: $0.1180
🔥 Major Target Zone: $0.1550 – $0.1680
✅ The strongest bullish confirmation would come from a 3D candle close above the trendline, followed by a successful retest, where the former resistance becomes a new support level.
---
🔴📉 Bearish Scenario
⚠️ If price fails to break the descending trendline and gets rejected again, the long-term bearish structure remains valid.
📉 A rejection could pushPOL back toward the lower support area:
🟨 Support: $0.075
🟨 Major Support: $0.0674
🚨 A decisive breakdown below the major support could signal further downside and potentially invalidate the immediate bullish breakout thesis.
---
🧠📌 Key Levels to Watch
🟡 $0.0674 – $0.0750 → Major Support / Demand Area
🟠 $0.1007 → First Important Resistance
🟠 $0.1100 – $0.1180 → Resistance Zone
🔴 $0.1550 – $0.1680 → Major Resistance Zone
🚀 Above Descending Trendline → Potential Bullish Structure Shift
---
🔥📊 Conclusion
POL is approaching a critical long-term descending trendline after an extended period of bearish price action.
🎯 The setup is relatively clear:
🟢 Breakout + 3D candle close above the trendline
➡️ Potential bullish confirmation and possible move toward $0.10–$0.118, followed by $0.155–$0.168.
🔴 Rejection from the trendline
➡️ The bearish structure remains intact, with $0.067–$0.075 becoming the key downside support zone.
👀🔥 The next confirmed reaction around the descending trendline could play an important role in determining the next major move for $POL.
⚠️ DYOR — Not Financial Advice.
#POL #Polygon #Crypto #CryptoAnalysis #TechnicalAnalysis #Altcoins #CryptoTrading #PriceAction #DescendingTrendline #Breakout #Bullish #Bearish #POLUSDT
💵 Coin:
POL / USDT⌛ Time Frame: 3D
📉 Pattern: Descending Trendline
📍 Current Price: Around $0.08
🟡 Key Support: $0.067 – $0.075
🎯 Key Resistance: $0.1007 – $0.1180
🚀 Major Resistance: $0.1550 – $0.1680
---
📉🔍 Pattern Analysis
POL remains within a long-term bearish structure, with price consistently trading below the descending yellow trendline.📐 The Descending Trendline has acted as dynamic resistance since the major high around $0.76, repeatedly limiting bullish recovery attempts and contributing to the formation of lower highs.
🔎 However, price is now approaching the trendline again after trading relatively close to the major support area around $0.067–$0.075.
⚠️ This creates an important decision zone:
🟢 A confirmed breakout could signal that the long-term bearish trend is beginning to lose momentum.
🔴 Another rejection could maintain the existing bearish structure and potentially lead to another move lower.
---
🟢🚀 Bullish Scenario
📈 Bullish confirmation would occur if
POL successfully breaks and closes above the descending trendline.💥 A confirmed breakout could indicate that the long-term bearish trend is weakening and potentially open the way toward the next resistance zones:
🎯 Target 1: $0.1007
🎯 Target 2: $0.1100
🎯 Target 3: $0.1180
🔥 Major Target Zone: $0.1550 – $0.1680
✅ The strongest bullish confirmation would come from a 3D candle close above the trendline, followed by a successful retest, where the former resistance becomes a new support level.
---
🔴📉 Bearish Scenario
⚠️ If price fails to break the descending trendline and gets rejected again, the long-term bearish structure remains valid.
📉 A rejection could push
POL back toward the lower support area:🟨 Support: $0.075
🟨 Major Support: $0.0674
🚨 A decisive breakdown below the major support could signal further downside and potentially invalidate the immediate bullish breakout thesis.
---
🧠📌 Key Levels to Watch
🟡 $0.0674 – $0.0750 → Major Support / Demand Area
🟠 $0.1007 → First Important Resistance
🟠 $0.1100 – $0.1180 → Resistance Zone
🔴 $0.1550 – $0.1680 → Major Resistance Zone
🚀 Above Descending Trendline → Potential Bullish Structure Shift
---
🔥📊 Conclusion
POL is approaching a critical long-term descending trendline after an extended period of bearish price action.🎯 The setup is relatively clear:
🟢 Breakout + 3D candle close above the trendline
➡️ Potential bullish confirmation and possible move toward $0.10–$0.118, followed by $0.155–$0.168.
🔴 Rejection from the trendline
➡️ The bearish structure remains intact, with $0.067–$0.075 becoming the key downside support zone.
👀🔥 The next confirmed reaction around the descending trendline could play an important role in determining the next major move for $POL.
⚠️ DYOR — Not Financial Advice.
#POL #Polygon #Crypto #CryptoAnalysis #TechnicalAnalysis #Altcoins #CryptoTrading #PriceAction #DescendingTrendline #Breakout #Bullish #Bearish #POLUSDT

✅ Get Free Signals! Join Our Telegram Channel Here: t.me/TheCryptoNuclear
✅ Twitter: twitter.com/crypto_nuclear
✅ Join Bybit : partner.bybit.com/b/nuclearvip
✅ Benefits : Lifetime Trading Fee Discount -50%
✅ Twitter: twitter.com/crypto_nuclear
✅ Join Bybit : partner.bybit.com/b/nuclearvip
✅ Benefits : Lifetime Trading Fee Discount -50%
免责声明
这些信息和出版物并非旨在提供,也不构成TradingView提供或认可的任何形式的财务、投资、交易或其他类型的建议或推荐。请阅读使用条款了解更多信息。
✅ Get Free Signals! Join Our Telegram Channel Here: t.me/TheCryptoNuclear
✅ Twitter: twitter.com/crypto_nuclear
✅ Join Bybit : partner.bybit.com/b/nuclearvip
✅ Benefits : Lifetime Trading Fee Discount -50%
✅ Twitter: twitter.com/crypto_nuclear
✅ Join Bybit : partner.bybit.com/b/nuclearvip
✅ Benefits : Lifetime Trading Fee Discount -50%
免责声明
这些信息和出版物并非旨在提供,也不构成TradingView提供或认可的任何形式的财务、投资、交易或其他类型的建议或推荐。请阅读使用条款了解更多信息。