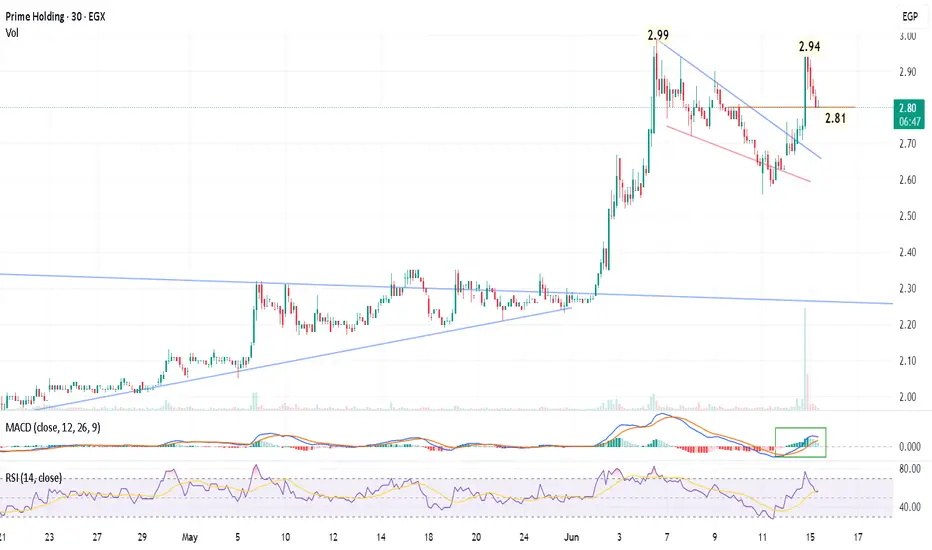
 PRMH 30-min Chart
1. Pattern & Price Action Analysis
Bullish Flag Breakout: Following a strong rally up to a peak of 2.99 EGP, the stock entered a clear corrective downward channel (bullish flag pattern). It has successfully broken out above the upper descending trendline of this flag.
Support & Resistance Setup:
The stock hit a recent peak at 2.94 EGP post-breakout and is currently retracing to test the immediate horizontal support level at 2.81 EGP (Current Price: 2.81 EGP).
Holding above 2.81 EGP on a 30-minute closing basis confirms a healthy breakout-retest flip.
Volume Confirmation: The initial breakout move was supported by a noticeable surge in volume, validating buying interest at the lower bounds of the flag.
2. Indicators & Momentum
MACD (12, 26, 9):
A bullish crossover has occurred below the zero line, and the MACD line is actively curling upward (highlighted by the green box).
The histogram has transitioned into positive momentum (green bars), signaling strong renewed buying pressure.
RSI (14):
Currently sits at 56.89, cooling off nicely from overbought territory into a healthy neutral-bullish zone. This leaves plenty of room for an upside extension without immediate exhaustion.
🎯 Trading Plan & Targets
Entry Zone: Around 2.81 EGP (on confirmed support stability) up to 2.83 EGP.
Immediate Target (T1): 2.94 EGP (Recent minor peak resistance).
Major Target (T2): 2.99 EGP - 3.00 EGP (Previous swing high / psychological resistance).
Stop Loss (SL): Daily close below 2.72 EGP (invalidating the flag breakout structure).

免责声明
这些信息和出版物并非旨在提供,也不构成TradingView提供或认可的任何形式的财务、投资、交易或其他类型的建议或推荐。请阅读使用条款了解更多信息。