
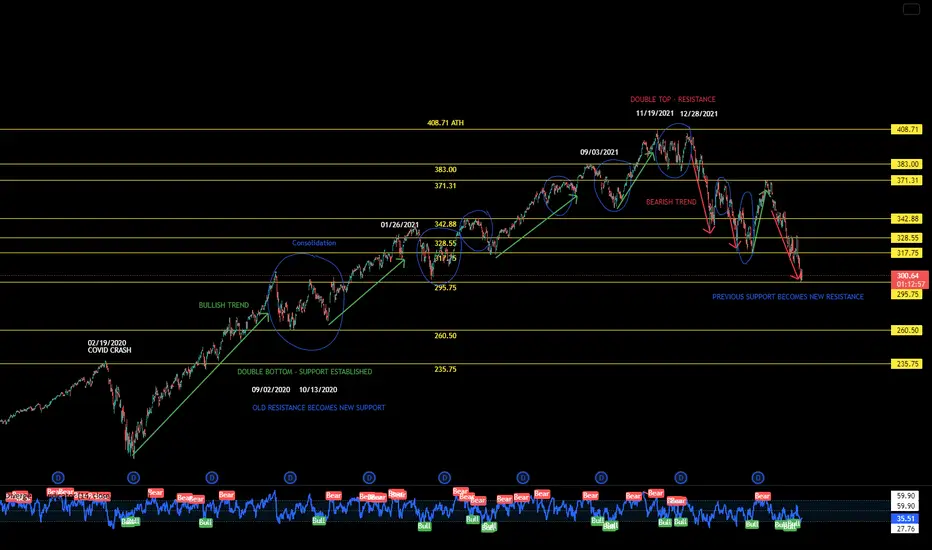
2 year chart starting with the COVID flash crash Feb 19, 2020 to current day, May 10, 2022. Dates on the chart indicated when support and resistance are established. Areas of consolidation circled in blue.

免责声明
这些信息和出版物并非旨在提供,也不构成TradingView提供或认可的任何形式的财务、投资、交易或其他类型的建议或推荐。请阅读使用条款了解更多信息。
免责声明
这些信息和出版物并非旨在提供,也不构成TradingView提供或认可的任何形式的财务、投资、交易或其他类型的建议或推荐。请阅读使用条款了解更多信息。