
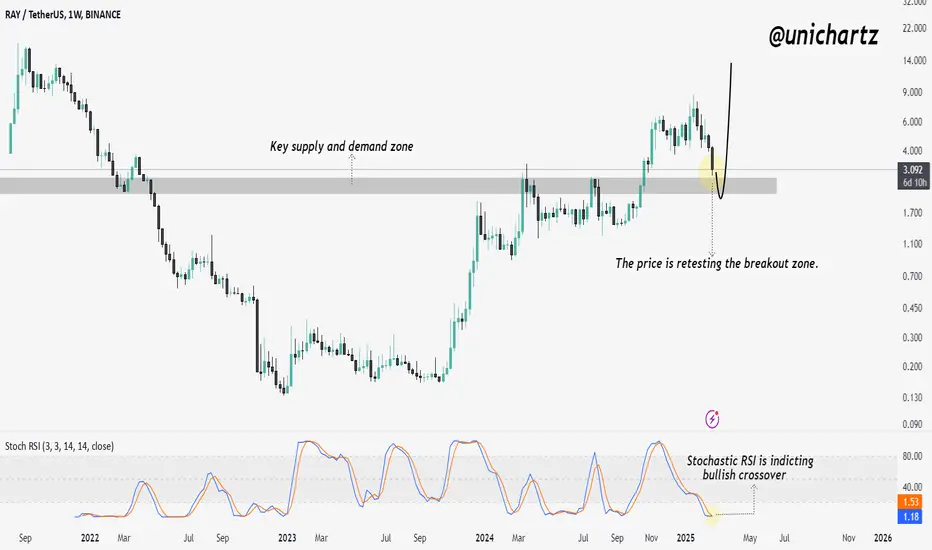
RRAY/USDT chart shows a key retest of the breakout zone, which previously acted as resistance and is now a crucial support level. A successful bounce could confirm bullish continuation, while a breakdown may lead to further downside.
Additionally, the Stochastic RSI is signaling a bullish crossover at oversold levels, indicating potential upward momentum. If buyers hold this zone, RAY could see a strong rally.
DYOR, NFA
Additionally, the Stochastic RSI is signaling a bullish crossover at oversold levels, indicating potential upward momentum. If buyers hold this zone, RAY could see a strong rally.
DYOR, NFA

Daily Free Signals :bit.ly/UnichartzAlpha
Register on Bitunix and trade with me: 👇
bitunix.com/register?vipCode=coEA
Register on Bitunix and trade with me: 👇
bitunix.com/register?vipCode=coEA
免责声明
这些信息和出版物并非旨在提供,也不构成TradingView提供或认可的任何形式的财务、投资、交易或其他类型的建议或推荐。请阅读使用条款了解更多信息。
Daily Free Signals :bit.ly/UnichartzAlpha
Register on Bitunix and trade with me: 👇
bitunix.com/register?vipCode=coEA
Register on Bitunix and trade with me: 👇
bitunix.com/register?vipCode=coEA
免责声明
这些信息和出版物并非旨在提供,也不构成TradingView提供或认可的任何形式的财务、投资、交易或其他类型的建议或推荐。请阅读使用条款了解更多信息。