RBS – Poised for bearish break
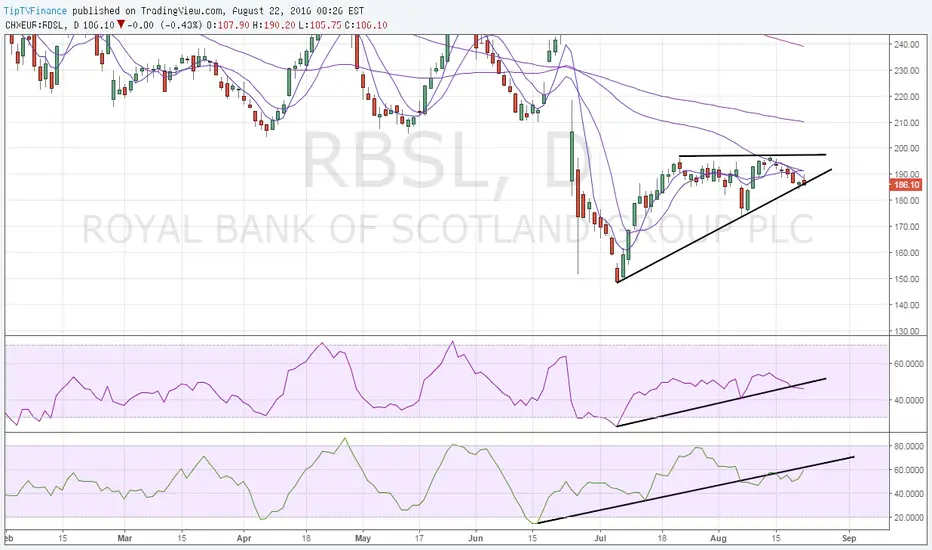
Daily chart pattern – Bearish breakout from rising wedge
Failure to hold above 50-DMA if followed by bearish break from rising wedge on day end closing basis coupled with daily RSI breaching rising trend line and falling money flow index would signal a sell-off to 173.80 (Aug 5 low).
On the higher side, only day end close above 50-DMA would signal bearish invalidation.
Failure to hold above 50-DMA if followed by bearish break from rising wedge on day end closing basis coupled with daily RSI breaching rising trend line and falling money flow index would signal a sell-off to 173.80 (Aug 5 low).
On the higher side, only day end close above 50-DMA would signal bearish invalidation.

免责声明
这些信息和出版物并非旨在提供,也不构成TradingView提供或认可的任何形式的财务、投资、交易或其他类型的建议或推荐。请阅读使用条款了解更多信息。