
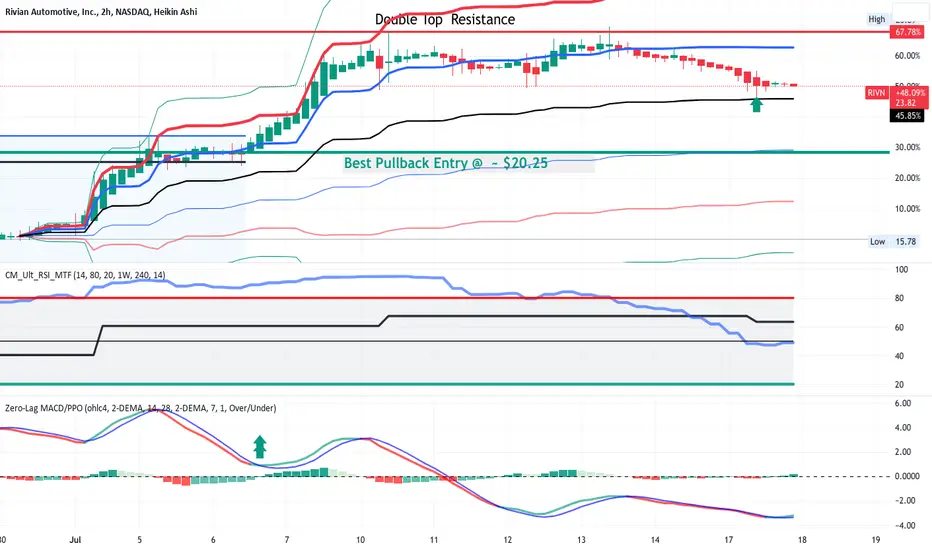
RIVN on the 2H chart rose 67% to begin July as part of the larger EV sector rally
which included several other tickers including those from UK and China. It has
pulled back significantly since completing a double top on July 13th. Price is
now hovering over and supported by the mean VWAP line anchored to July 1st.
The two time frame RSI indicator shows both lower (blue line) ane higher time
frame ( black line) RSIs at 50 or higher with the blue line closer to that transition
zone. The zero-lag MACD shows the subtle cross under the histogram which
has changed from negative to positive. Overall, although the best entry is at
$20 from a very deep pullback, I believe that RIVN is now setup for a long trade
following a continuation or even a call option contracts trade. I will take a
position in call options at this time.
which included several other tickers including those from UK and China. It has
pulled back significantly since completing a double top on July 13th. Price is
now hovering over and supported by the mean VWAP line anchored to July 1st.
The two time frame RSI indicator shows both lower (blue line) ane higher time
frame ( black line) RSIs at 50 or higher with the blue line closer to that transition
zone. The zero-lag MACD shows the subtle cross under the histogram which
has changed from negative to positive. Overall, although the best entry is at
$20 from a very deep pullback, I believe that RIVN is now setup for a long trade
following a continuation or even a call option contracts trade. I will take a
position in call options at this time.

免责声明
这些信息和出版物并非旨在提供,也不构成TradingView提供或认可的任何形式的财务、投资、交易或其他类型的建议或推荐。请阅读使用条款了解更多信息。
免责声明
这些信息和出版物并非旨在提供,也不构成TradingView提供或认可的任何形式的财务、投资、交易或其他类型的建议或推荐。请阅读使用条款了解更多信息。