
Experimental analysis with the intention to follow back later on as I am still learning
I thought I'd share this as it seems interesting, given its low probability.
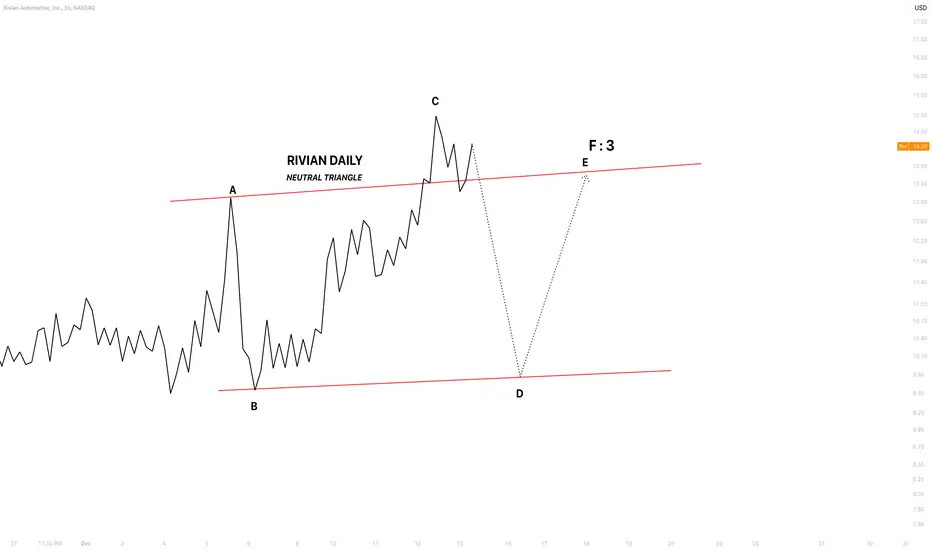
The lines represent a projected path and do not represent time
The pattern forms a neutral triangle.
Wave C is the largest, potentially 138% to 161.8% of wave A.
In this scenario, wave C concludes at 138%, provided my calculations are correct.
Any movement above wave C would invalidate this pattern.
I anticipate a significant sell-off to begin shortly for this to be accurate.
Let's see how this goes
I thought I'd share this as it seems interesting, given its low probability.
The lines represent a projected path and do not represent time
The pattern forms a neutral triangle.
Wave C is the largest, potentially 138% to 161.8% of wave A.
In this scenario, wave C concludes at 138%, provided my calculations are correct.
Any movement above wave C would invalidate this pattern.
I anticipate a significant sell-off to begin shortly for this to be accurate.
Let's see how this goes
注释
It appears that the rally has concluded and wave C has come to an end.
免责声明
这些信息和出版物并非旨在提供,也不构成TradingView提供或认可的任何形式的财务、投资、交易或其他类型的建议或推荐。请阅读使用条款了解更多信息。
免责声明
这些信息和出版物并非旨在提供,也不构成TradingView提供或认可的任何形式的财务、投资、交易或其他类型的建议或推荐。请阅读使用条款了解更多信息。