iExec RLC (RLC) Long-Term Chart W/ 1330%+ Potential Mapped
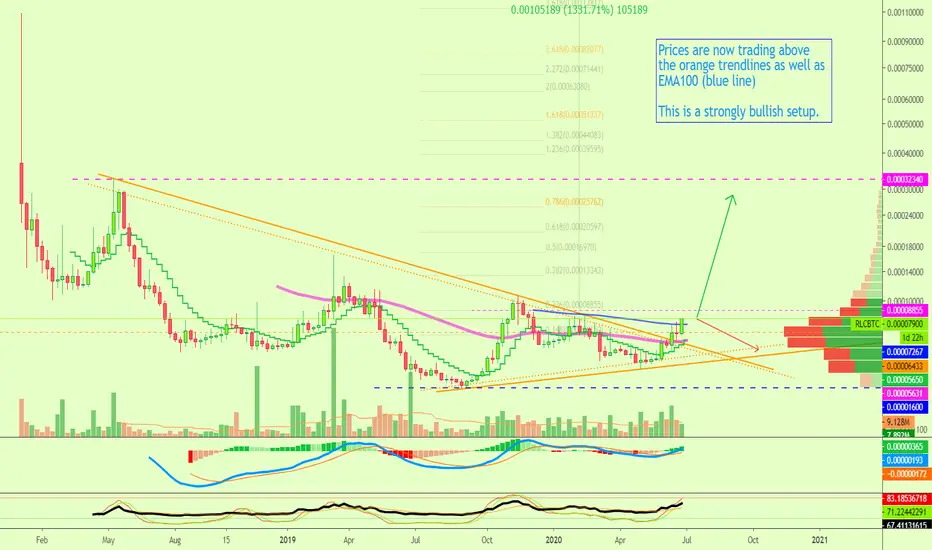
Here we have iExec RLC (RLCBTC) moving above EMA100 and also breaking above the orange trendlines on the chart... Turning this set up into an extremely bullish one.
NOTE | If prices break and close below EMA50/100 the above signals are invalidated.
The week closes Sunday; we are looking at the weekly chart.
Other than this small detail we are extremely bullish on RLCBTC.
This is one of the many altcoins now trading above EMA100. Those that moved above this level on the weekly timeframe have been growing massively, so we can expect similar action if the same trend/pattern is followed.
Namaste.
NOTE | If prices break and close below EMA50/100 the above signals are invalidated.
The week closes Sunday; we are looking at the weekly chart.
Other than this small detail we are extremely bullish on RLCBTC.
This is one of the many altcoins now trading above EMA100. Those that moved above this level on the weekly timeframe have been growing massively, so we can expect similar action if the same trend/pattern is followed.
Namaste.

✅ Cryptocurrencies technical analysis & results
t.me/masteranandatrades/9279
✅ Stocks technical analysis
t.me/anandastocks
✅ Enjoyed the content? Join my PREMIUM channels for more... t.me/lamatrades/4 (since 2017)
t.me/masteranandatrades/9279
✅ Stocks technical analysis
t.me/anandastocks
✅ Enjoyed the content? Join my PREMIUM channels for more... t.me/lamatrades/4 (since 2017)
相关出版物
免责声明
这些信息和出版物并非旨在提供,也不构成TradingView提供或认可的任何形式的财务、投资、交易或其他类型的建议或推荐。请阅读使用条款了解更多信息。
✅ Cryptocurrencies technical analysis & results
t.me/masteranandatrades/9279
✅ Stocks technical analysis
t.me/anandastocks
✅ Enjoyed the content? Join my PREMIUM channels for more... t.me/lamatrades/4 (since 2017)
t.me/masteranandatrades/9279
✅ Stocks technical analysis
t.me/anandastocks
✅ Enjoyed the content? Join my PREMIUM channels for more... t.me/lamatrades/4 (since 2017)
相关出版物
免责声明
这些信息和出版物并非旨在提供,也不构成TradingView提供或认可的任何形式的财务、投资、交易或其他类型的建议或推荐。请阅读使用条款了解更多信息。