做多
Weekly Falling Wedge Breakout & Targets
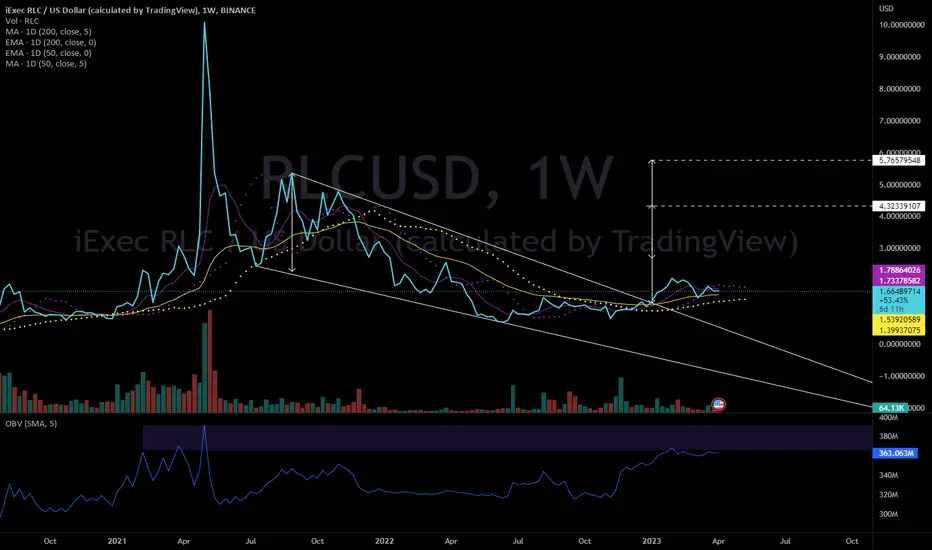
Simple weekly chart here, RLC broke out of a falling wedge earlier in the year, with targets around 4.32 and 5.76.
Note - Last time OBV rose to these levels we saw a spike up to 10-12 dollars. We also see golden crosses on the 50/200 day EMA and MA
Note - Last time OBV rose to these levels we saw a spike up to 10-12 dollars. We also see golden crosses on the 50/200 day EMA and MA

免责声明
这些信息和出版物并非旨在提供,也不构成TradingView提供或认可的任何形式的财务、投资、交易或其他类型的建议或推荐。请阅读使用条款了解更多信息。
免责声明
这些信息和出版物并非旨在提供,也不构成TradingView提供或认可的任何形式的财务、投资、交易或其他类型的建议或推荐。请阅读使用条款了解更多信息。