
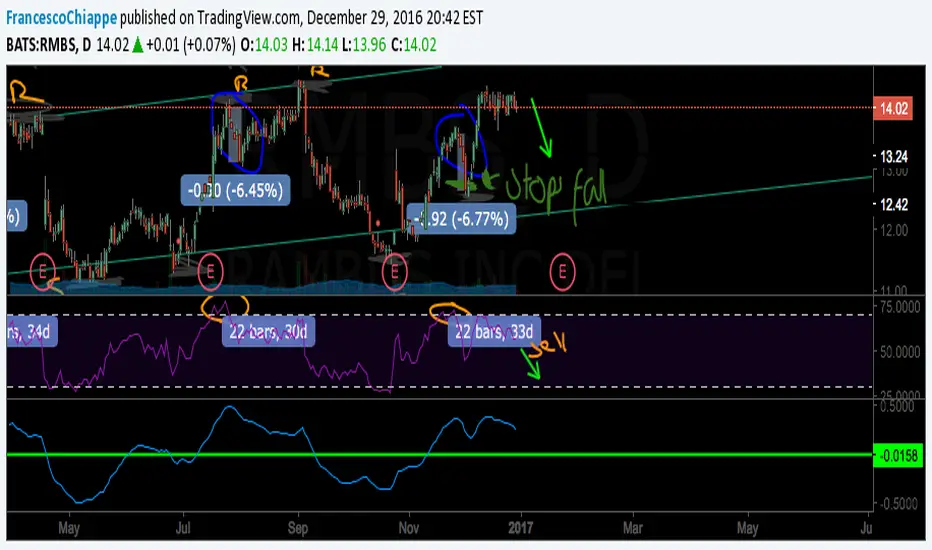
I have been following this stock for a long time and have made great returns with it. The pattern scheme between the chart and the RSI can be used to predict an upcoming downtrend in the price of RMBS. Once the RSI exceeds 75 the chart bounces as the RSI levels out. This leveling out process takes about 20 bars (1 D) and then drops again. The MACD is also showing bearish signs. Any feedback or suggestions would be greatly appreciated!
Also:
Many of the drawings were done prior to movement in the chart. For example, my prediction of the "Stop Fall" in green was done prior to the chart actually stopping at the line.
Also:
Many of the drawings were done prior to movement in the chart. For example, my prediction of the "Stop Fall" in green was done prior to the chart actually stopping at the line.

免责声明
这些信息和出版物并非旨在提供,也不构成TradingView提供或认可的任何形式的财务、投资、交易或其他类型的建议或推荐。请阅读使用条款了解更多信息。
免责声明
这些信息和出版物并非旨在提供,也不构成TradingView提供或认可的任何形式的财务、投资、交易或其他类型的建议或推荐。请阅读使用条款了解更多信息。