
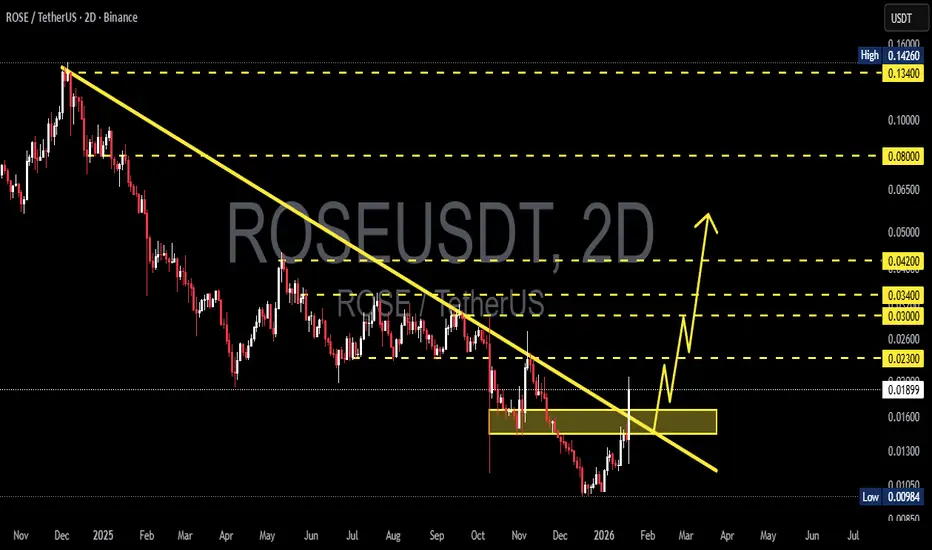
ROSE/USDT remains in a medium- to long-term bearish structure, characterized by a clear sequence of lower highs and lower lows since the late-2024 peak. Price is currently reacting around the historical demand zone at 0.0167 – 0.0144, which previously acted as an accumulation area before a major breakdown.
The 2D timeframe confirms that this move is not short-term noise, but a key structural phase.
---
Structure & Technical Pattern
1. Descending Trendline (Major Resistance)
The descending trendline is drawn from the ATH around 0.14 through subsequent lower highs.
Price is testing the trendline from below, indicating a resistance retest, not a confirmed breakout.
2. Breakdown – Retest Structure
Price previously experienced a strong breakdown below the 0.023–0.020 zone.
After forming a lower low near 0.0098, price bounced and is now retesting the former supply area (yellow box).
3. Yellow Zone (0.0167 – 0.0144)
This zone is critical because:
It represents former support turned resistance
It was a consolidation area before further distribution
It acts as a decision zone between structural reversal and bearish continuation
---
Key Levels
Resistance:
0.0167 – 0.0180 (yellow zone + trendline)
0.0230
0.0300
0.0340
0.0420
Support:
0.0144 (lower boundary of the yellow zone)
0.0120
0.0098 (major low / last demand)
---
Bullish Scenario
Primary conditions:
A strong daily/2D close above 0.0180
Break and hold above the descending trendline
Bullish confirmation:
Formation of a higher low above 0.0144
Increasing volume during the breakout
Upside targets:
0.0230
0.0300
0.0340
0.0420 (next major resistance)
Bullish meaning: Such a breakout would signal the end of the prolonged bearish channel and open the door for a medium-term trend reversal.
---
Bearish Scenario
If price fails at the yellow zone:
Rejection or long upper wicks around 0.0167–0.0180
Price closes back below 0.0144
Downside targets:
0.0120
0.0098 (previous low)
Extended bearish risk:
A breakdown below 0.0098 would lead to bearish continuation and downside price discovery
The broader downtrend remains intact
---
Conclusion
ROSE/USDT is currently trading within a major decision area.
The 0.0167 – 0.0144 zone represents a critical battle zone between buyers and sellers.
Break and hold above the trendline → reversal potential
Rejection at the yellow zone → pullback before further downside
Waiting for candle confirmation is essential, rather than anticipating direction inside the zone.
#ROSEUSDT #ROSE #CryptoAnalysis #Altcoin #DescendingTrendline #BreakoutOrReject #SupplyDemand #Downtrend #TrendReversal
The 2D timeframe confirms that this move is not short-term noise, but a key structural phase.
---
Structure & Technical Pattern
1. Descending Trendline (Major Resistance)
The descending trendline is drawn from the ATH around 0.14 through subsequent lower highs.
Price is testing the trendline from below, indicating a resistance retest, not a confirmed breakout.
2. Breakdown – Retest Structure
Price previously experienced a strong breakdown below the 0.023–0.020 zone.
After forming a lower low near 0.0098, price bounced and is now retesting the former supply area (yellow box).
3. Yellow Zone (0.0167 – 0.0144)
This zone is critical because:
It represents former support turned resistance
It was a consolidation area before further distribution
It acts as a decision zone between structural reversal and bearish continuation
---
Key Levels
Resistance:
0.0167 – 0.0180 (yellow zone + trendline)
0.0230
0.0300
0.0340
0.0420
Support:
0.0144 (lower boundary of the yellow zone)
0.0120
0.0098 (major low / last demand)
---
Bullish Scenario
Primary conditions:
A strong daily/2D close above 0.0180
Break and hold above the descending trendline
Bullish confirmation:
Formation of a higher low above 0.0144
Increasing volume during the breakout
Upside targets:
0.0230
0.0300
0.0340
0.0420 (next major resistance)
Bullish meaning: Such a breakout would signal the end of the prolonged bearish channel and open the door for a medium-term trend reversal.
---
Bearish Scenario
If price fails at the yellow zone:
Rejection or long upper wicks around 0.0167–0.0180
Price closes back below 0.0144
Downside targets:
0.0120
0.0098 (previous low)
Extended bearish risk:
A breakdown below 0.0098 would lead to bearish continuation and downside price discovery
The broader downtrend remains intact
---
Conclusion
ROSE/USDT is currently trading within a major decision area.
The 0.0167 – 0.0144 zone represents a critical battle zone between buyers and sellers.
Break and hold above the trendline → reversal potential
Rejection at the yellow zone → pullback before further downside
Waiting for candle confirmation is essential, rather than anticipating direction inside the zone.
#ROSEUSDT #ROSE #CryptoAnalysis #Altcoin #DescendingTrendline #BreakoutOrReject #SupplyDemand #Downtrend #TrendReversal

✅ Get Free Signals! Join Our Telegram Channel Here: t.me/TheCryptoNuclear
✅ Twitter: twitter.com/crypto_nuclear
✅ Join Bybit : partner.bybit.com/b/nuclearvip
✅ Benefits : Lifetime Trading Fee Discount -50%
✅ Twitter: twitter.com/crypto_nuclear
✅ Join Bybit : partner.bybit.com/b/nuclearvip
✅ Benefits : Lifetime Trading Fee Discount -50%
免责声明
这些信息和出版物并非旨在提供,也不构成TradingView提供或认可的任何形式的财务、投资、交易或其他类型的建议或推荐。请阅读使用条款了解更多信息。
✅ Get Free Signals! Join Our Telegram Channel Here: t.me/TheCryptoNuclear
✅ Twitter: twitter.com/crypto_nuclear
✅ Join Bybit : partner.bybit.com/b/nuclearvip
✅ Benefits : Lifetime Trading Fee Discount -50%
✅ Twitter: twitter.com/crypto_nuclear
✅ Join Bybit : partner.bybit.com/b/nuclearvip
✅ Benefits : Lifetime Trading Fee Discount -50%
免责声明
这些信息和出版物并非旨在提供,也不构成TradingView提供或认可的任何形式的财务、投资、交易或其他类型的建议或推荐。请阅读使用条款了解更多信息。