
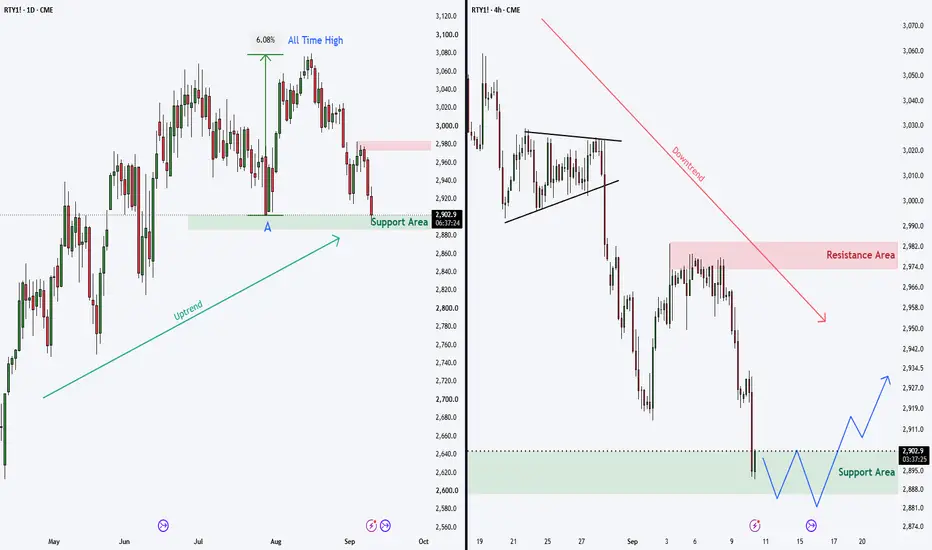
RTY1! Multiple Timeframe Analysis:
On the Daily chart (LEFT), we can see that this price zone (A) previously acted as support and led to a strong +6% move to a new all-time high. The Daily chart is still in an uptrend.
However, the 4H chart (RIGHT) is trending steadily lower, and at the moment there is no clear sign that the downtrend is coming to an end.
Since the Daily trend (LEFT) remains intact, we could potentially see a bullish reversal if a double bottom, a breakdown failure, or a strong bullish candle forms on the 4H chart (RIGHT). Such a setup could lead to an upward move toward the $2,980 resistance area, or potentially even higher.

免责声明
这些信息和出版物并非旨在提供,也不构成TradingView提供或认可的任何形式的财务、投资、交易或其他类型的建议或推荐。请阅读使用条款了解更多信息。