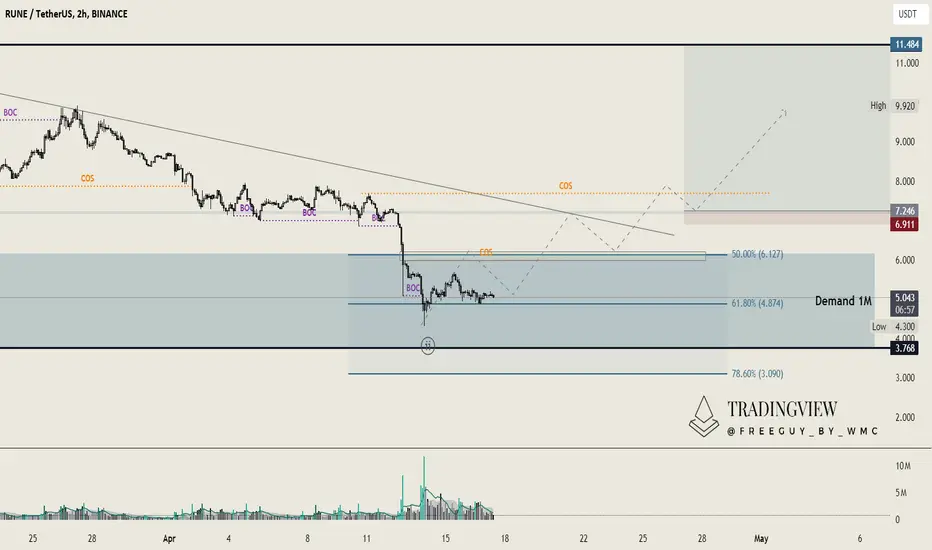
On the two-hour timeframe, the clarity of the market movements for 
 RUNEUSDT becomes even more evident. The end of Wave ((i)) is marked by our high at $11.47. Following this peak, there has been a consistent downtrend, punctuated by a brief corrective phase—this is typical market Elliott Wave behavior.
We potentially have the end of Wave ((ii)) established within the 50% to 78.6% retracement levels. Additionally, a Fair Value Gap (FVG) is marked in yellow on this chart. This scenario presents a second strategic play for Rune.
We would wait for the price to rise, triggering a change in structure. This would involve retesting the trendline and the Fair Value Gap, then breaking out above and re-touching the support zone where we could place our entry.
This strategy would represent a short-term trade opportunity but is quite intriguing due to the dynamics at play on the lower timeframe. It’s feasible that we might follow this plan depending on how the situation develops with Rune.
RUNEUSDT becomes even more evident. The end of Wave ((i)) is marked by our high at $11.47. Following this peak, there has been a consistent downtrend, punctuated by a brief corrective phase—this is typical market Elliott Wave behavior.We potentially have the end of Wave ((ii)) established within the 50% to 78.6% retracement levels. Additionally, a Fair Value Gap (FVG) is marked in yellow on this chart. This scenario presents a second strategic play for Rune.
We would wait for the price to rise, triggering a change in structure. This would involve retesting the trendline and the Fair Value Gap, then breaking out above and re-touching the support zone where we could place our entry.
This strategy would represent a short-term trade opportunity but is quite intriguing due to the dynamics at play on the lower timeframe. It’s feasible that we might follow this plan depending on how the situation develops with Rune.

相关出版物
免责声明
这些信息和出版物并非旨在提供,也不构成TradingView提供或认可的任何形式的财务、投资、交易或其他类型的建议或推荐。请阅读使用条款了解更多信息。