
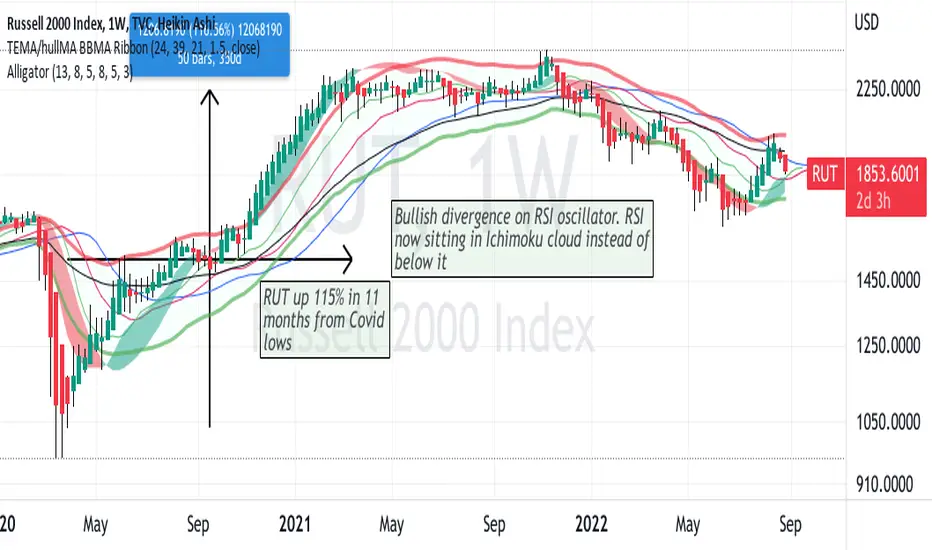
The RUT ETF crashed with the COVID market phenomenon but then recovered better and faster than the SPY in 116 % of price appreciation
in less than the one year that followed. Since then RUT retraced about 1/2 of that uptrend.
Presently on the weekly chart, the price is relatively stable. The RSI bottomed out in the oversold territory and is now in mid-range
with RSI above its Ichimoku cloud. All of this is positive or at least not the overly negative of doom and gloom.
I believe that it will soon be time to begin a dollar cost averaging into some long-term call options on RUT
as things are not as bad as the media, banks and large institutional players want to portray to retail traders and
investors.

免责声明
这些信息和出版物并非旨在提供,也不构成TradingView提供或认可的任何形式的财务、投资、交易或其他类型的建议或推荐。请阅读使用条款了解更多信息。
免责声明
这些信息和出版物并非旨在提供,也不构成TradingView提供或认可的任何形式的财务、投资、交易或其他类型的建议或推荐。请阅读使用条款了解更多信息。