
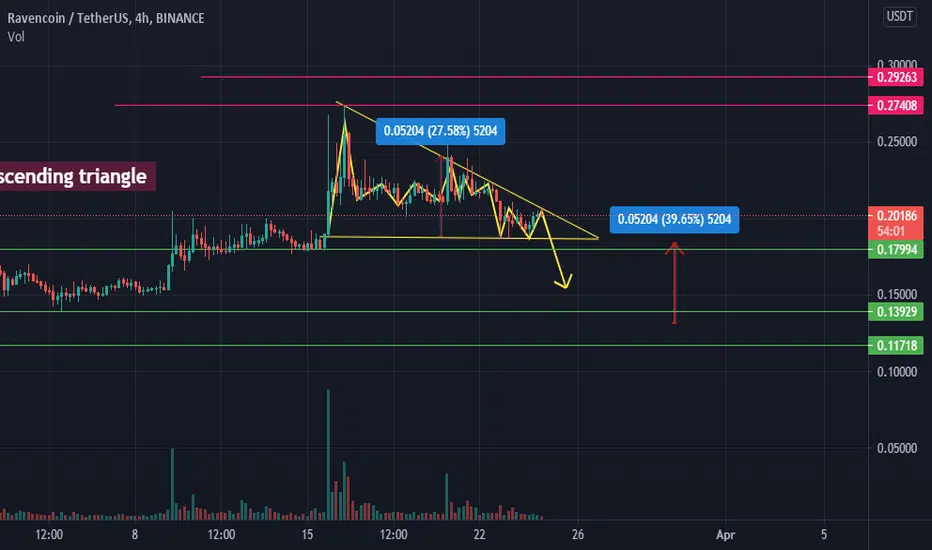
We can see a descending triangle on 4 hour chart of RVN/USDT (Binance).
DESCENDING TRIANGLE has bearish reversal interpretation.
If it breaks it support line it will breakdown to the marked point.
Red lines represents major resistances while green are showing major supports.
We can clearly see 2 valid taps on resistance line and support line inside the formed triangle.
Dial indicator showing ( Bought indicator ) means that the current volume is at sell signal.
DESCENDING TRIANGLE has bearish reversal interpretation.
If it breaks it support line it will breakdown to the marked point.
Red lines represents major resistances while green are showing major supports.
We can clearly see 2 valid taps on resistance line and support line inside the formed triangle.
Dial indicator showing ( Bought indicator ) means that the current volume is at sell signal.

免责声明
这些信息和出版物并非旨在提供,也不构成TradingView提供或认可的任何形式的财务、投资、交易或其他类型的建议或推荐。请阅读使用条款了解更多信息。
免责声明
这些信息和出版物并非旨在提供,也不构成TradingView提供或认可的任何形式的财务、投资、交易或其他类型的建议或推荐。请阅读使用条款了解更多信息。