已更新
Soybean - A Descending Triangle Pattern
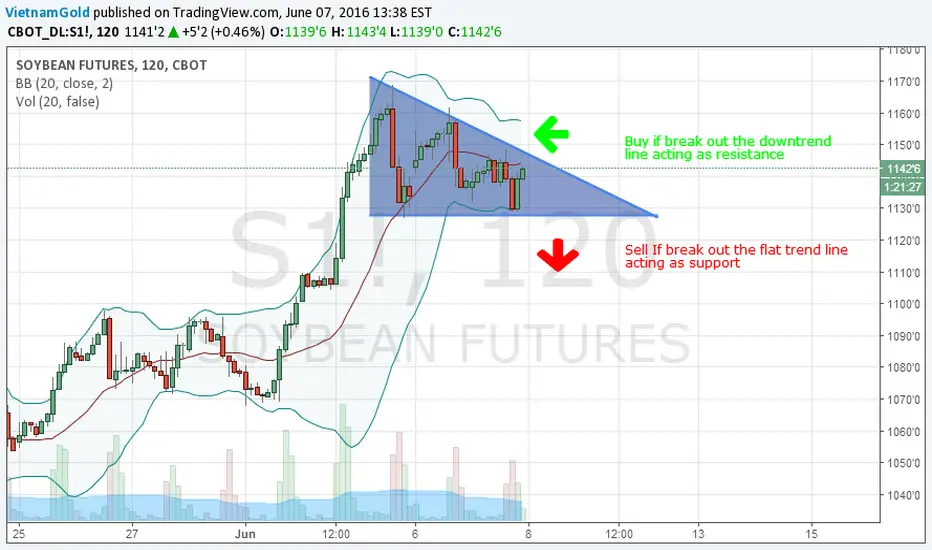
Le'ts take a look at the Soybean Futures market by examining its 2hr chart. What do we see:
- Price has consolidated in a descending triangle.
- Support @1130 running flat
- Resistance is the downtrend line.
- A break out of either way will tell us about its next going direction.
A descending triangle is usually a continuation pattern so here the upside is favored as Soybean price is bullish in daily and weekly chart. There are instances when descending triangles form as reversal patterns at the end of an uptrend, but they are typically continuation patterns.
Stay Tuned.
交易开始
Bought 10 contracts @11.4725 since price broke out to the upside注释
Price is accelerating to the upside after break out.交易手动结束
Closed my trade @11.8725
免责声明
这些信息和出版物并非旨在提供,也不构成TradingView提供或认可的任何形式的财务、投资、交易或其他类型的建议或推荐。请阅读使用条款了解更多信息。
免责声明
这些信息和出版物并非旨在提供,也不构成TradingView提供或认可的任何形式的财务、投资、交易或其他类型的建议或推荐。请阅读使用条款了解更多信息。