
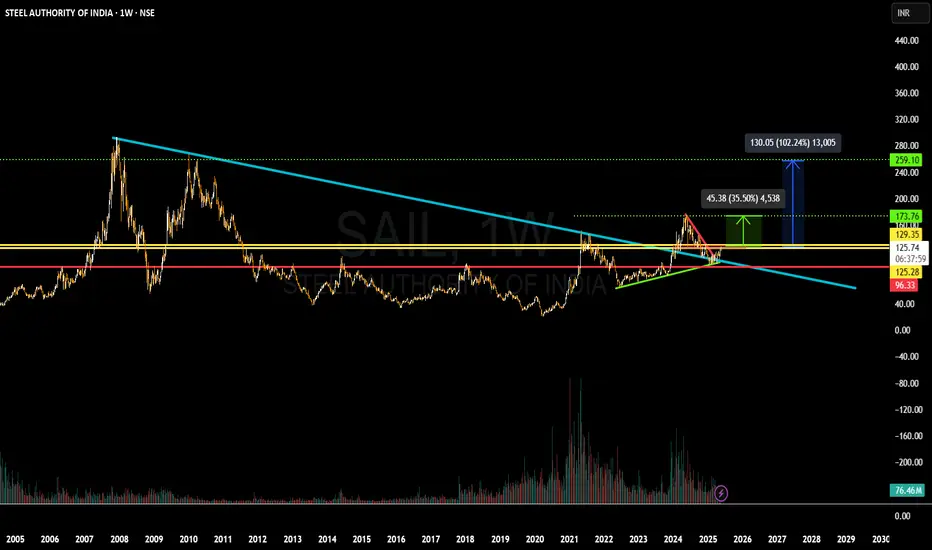
SAIL Technical Breakout Setup 📈
Current Price: ₹125.74 (+2.66%)
Date: May 23, 2025
Key Technical Levels
Entry Zone: Above yellow support zone (₹125-130 range)
Stop Loss: Red line at ₹96.33
Target 1: Green dotted line at ₹173.76 (+38% upside)
Target 2: Green dotted line at ₹259.10 (+106% upside)
Technical Analysis
Pattern Recognition:
SAIL is forming a long-term triangular consolidation pattern
Stock is approaching the apex of a multi-year triangle
Blue diagonal trendline acts as major resistance since 2008 highs
Yellow horizontal zone provides strong support
Current Market Structure:
Price is holding above the critical yellow support zone
Recent bounce shows buying interest at these levels
Volume appears to be picking up on the recent move
Probability Assessment
Target 1 (₹173.76) Probability: Moderate to High
This level represents the previous resistance zone
If breakout sustains above ₹130, this becomes achievable
Risk-reward ratio: Approximately 1:1.6
Target 2 (₹259.10) Probability: Lower
This is an ambitious target requiring significant momentum
Would need broader market support and sector rotation
Risk-reward ratio: Approximately 1:5.5
Trading Strategy
For Aggressive Traders:
Enter on sustained close above ₹130
Partial booking at Target 1
Trail stop loss for Target 2
For Conservative Traders:
Wait for weekly close above ₹135
Smaller position size given the risk
Risk Management:
Strict stop loss at ₹96.33 (23% downside risk)
Position sizing should reflect the volatility
⚠️ Important Notes:
Steel sector performance depends on infrastructure spending
Global commodity prices impact fundamentals
This is a technical setup - fundamental analysis required separately
This analysis is for educational purposes. Trade at your own risk.
Current Price: ₹125.74 (+2.66%)
Date: May 23, 2025
Key Technical Levels
Entry Zone: Above yellow support zone (₹125-130 range)
Stop Loss: Red line at ₹96.33
Target 1: Green dotted line at ₹173.76 (+38% upside)
Target 2: Green dotted line at ₹259.10 (+106% upside)
Technical Analysis
Pattern Recognition:
SAIL is forming a long-term triangular consolidation pattern
Stock is approaching the apex of a multi-year triangle
Blue diagonal trendline acts as major resistance since 2008 highs
Yellow horizontal zone provides strong support
Current Market Structure:
Price is holding above the critical yellow support zone
Recent bounce shows buying interest at these levels
Volume appears to be picking up on the recent move
Probability Assessment
Target 1 (₹173.76) Probability: Moderate to High
This level represents the previous resistance zone
If breakout sustains above ₹130, this becomes achievable
Risk-reward ratio: Approximately 1:1.6
Target 2 (₹259.10) Probability: Lower
This is an ambitious target requiring significant momentum
Would need broader market support and sector rotation
Risk-reward ratio: Approximately 1:5.5
Trading Strategy
For Aggressive Traders:
Enter on sustained close above ₹130
Partial booking at Target 1
Trail stop loss for Target 2
For Conservative Traders:
Wait for weekly close above ₹135
Smaller position size given the risk
Risk Management:
Strict stop loss at ₹96.33 (23% downside risk)
Position sizing should reflect the volatility
⚠️ Important Notes:
Steel sector performance depends on infrastructure spending
Global commodity prices impact fundamentals
This is a technical setup - fundamental analysis required separately
This analysis is for educational purposes. Trade at your own risk.

免责声明
这些信息和出版物并非旨在提供,也不构成TradingView提供或认可的任何形式的财务、投资、交易或其他类型的建议或推荐。请阅读使用条款了解更多信息。
免责声明
这些信息和出版物并非旨在提供,也不构成TradingView提供或认可的任何形式的财务、投资、交易或其他类型的建议或推荐。请阅读使用条款了解更多信息。