
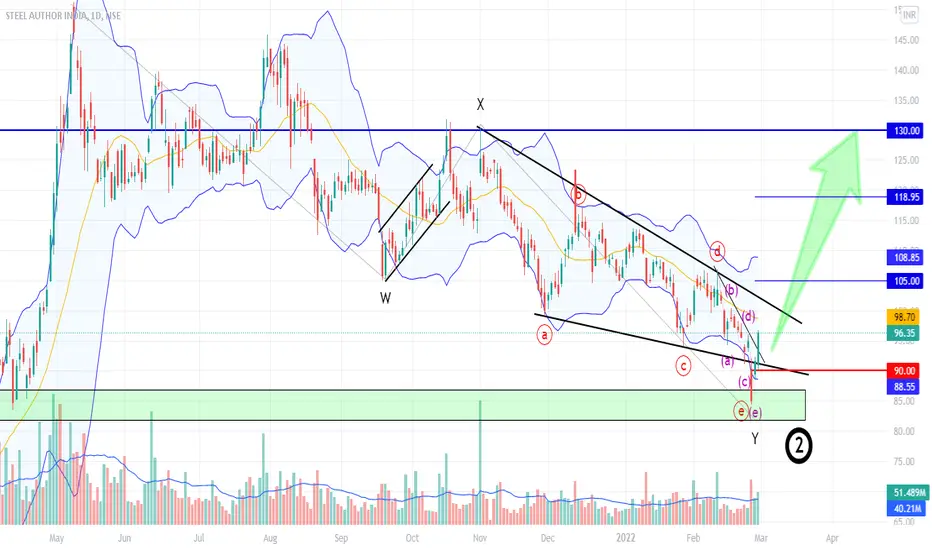
SAIL has marked oct top as X and then an ending diagonal, which should now be complete as prices have come back inside the wedge, wave E of wave Y is a shortest in the pattern even as it is a 'Under throw' below lower line, we can say like a fake breakdown, Now macd in hourly has turned positive along with macd in daily is converging towards north, also one trendline is broken on chart with good intensity of volume. it looks good to go long.
breakout with good intensity of volume

support from support area

macd in daily is converging towards north

macd in hourly positive

rsi in daily is uptick near 46

rsi in hourly above 60

Disclaimer
I am not sebi registered analyst
My studies are Educational purpose only
Please consult your Financial advisor before trading or investing
breakout with good intensity of volume
support from support area
macd in daily is converging towards north
macd in hourly positive
rsi in daily is uptick near 46
rsi in hourly above 60
Disclaimer
I am not sebi registered analyst
My studies are Educational purpose only
Please consult your Financial advisor before trading or investing

YouTube: youtube.com/@rk_charts
Telegram : t.me/RK_Charts
Twitter : @charts_rk
Email : rkcharts@gmail. com
Disclaimer.
I am not sebi registered analyst.
My studies are for educational purpose only.
Telegram : t.me/RK_Charts
Twitter : @charts_rk
Email : rkcharts@gmail. com
Disclaimer.
I am not sebi registered analyst.
My studies are for educational purpose only.
相关出版物
免责声明
这些信息和出版物并非旨在提供,也不构成TradingView提供或认可的任何形式的财务、投资、交易或其他类型的建议或推荐。请阅读使用条款了解更多信息。
YouTube: youtube.com/@rk_charts
Telegram : t.me/RK_Charts
Twitter : @charts_rk
Email : rkcharts@gmail. com
Disclaimer.
I am not sebi registered analyst.
My studies are for educational purpose only.
Telegram : t.me/RK_Charts
Twitter : @charts_rk
Email : rkcharts@gmail. com
Disclaimer.
I am not sebi registered analyst.
My studies are for educational purpose only.
相关出版物
免责声明
这些信息和出版物并非旨在提供,也不构成TradingView提供或认可的任何形式的财务、投资、交易或其他类型的建议或推荐。请阅读使用条款了解更多信息。