
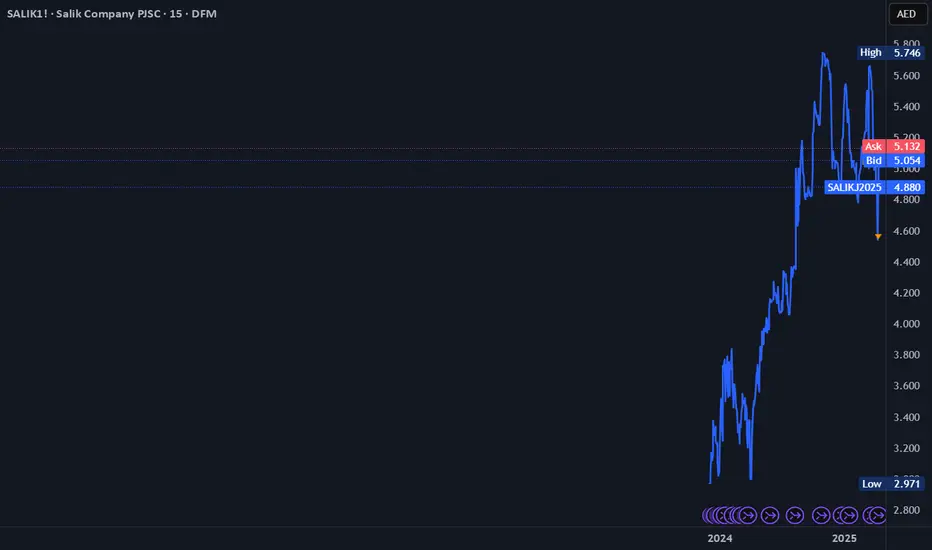
Current Price: AED 5.02
Daily Change: Decrease of AED 0.08 (-1.57%)
52-Week Range:
Low: AED 3.14
High: AED 5.89
Since its IPO in September 2022 at AED 2 per share, Salik has shown impressive growth of approximately 151% to date.
Performance vs. DFMGI (Dubai Financial Market General Index)
Salik has significantly outperformed the Dubai Financial Market Index.
Salik stock: +151% since IPO
DFMGI: Moderate growth over the same period
Technical Analysis
Moving Averages:
These indicators suggest the stock is in a sideways trend, with no clear upward or downward direction.
Support & Resistance Levels
A breakout above the resistance level could signal further gains, while a break below support might indicate potential downside.
Daily Change: Decrease of AED 0.08 (-1.57%)
52-Week Range:
Low: AED 3.14
High: AED 5.89
Since its IPO in September 2022 at AED 2 per share, Salik has shown impressive growth of approximately 151% to date.
Performance vs. DFMGI (Dubai Financial Market General Index)
Salik has significantly outperformed the Dubai Financial Market Index.
Salik stock: +151% since IPO
DFMGI: Moderate growth over the same period
Technical Analysis
- (Relative Strength Index): 51.9 → Neutral (no overbought or oversold signals)
- MACD (Moving Average Convergence Divergence): 0 → Momentum is balanced
- ADX (Average Directional Index): 27.1 → Indicates a weak trend
Moving Averages:
- 5-day MA: AED 5.09 → Buy signal
- 10-day MA: AED 5.06 → Buy signal
- 50-day MA: AED 5.10 → Sell signal
These indicators suggest the stock is in a sideways trend, with no clear upward or downward direction.
Support & Resistance Levels
- Support: AED 5.02
- Resistance: AED 5.18
A breakout above the resistance level could signal further gains, while a break below support might indicate potential downside.

免责声明
这些信息和出版物并非旨在提供,也不构成TradingView提供或认可的任何形式的财务、投资、交易或其他类型的建议或推荐。请阅读使用条款了解更多信息。