
Hello everyone!
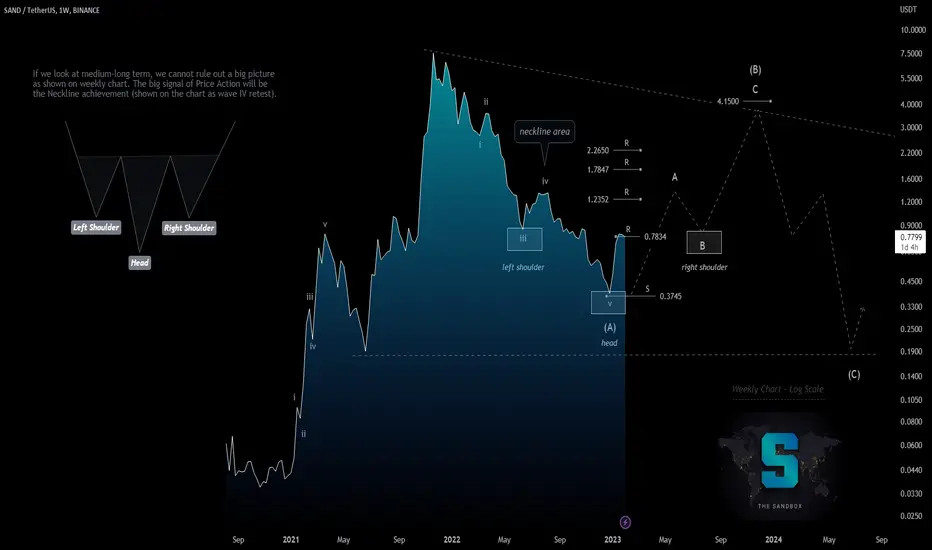
If we look at SAND in a medium-long term, we cannot rule out a big picture as shown on weekly chart. The big signal of Price Action will be the Neckline achievement (shown on chart as wave IV retest) of a large "Head & Shoulders". Working on daily time frame, I found some interesting resistance levels, useful for evaluating the strength of the trend, step by step.
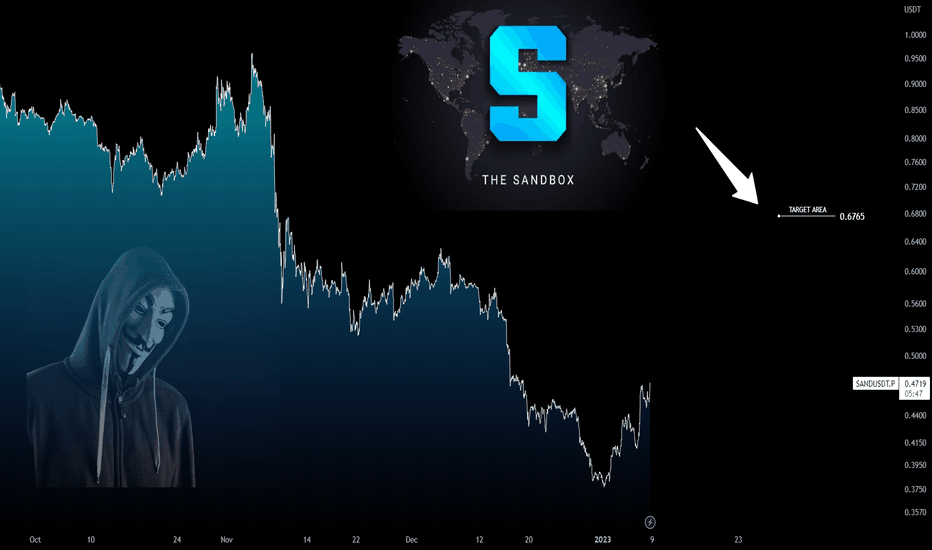
I came up with this idea thanks to our last trade on Sandbox, which developed a potential bullish impulse structure.
(Click and Play on Chart below)
If there are conditions, I will update this idea below.
...trade with care! 👍
Cheers!
If you think that my analysis is useful, please...
"Like, Share and Comment" ...thank you! 💖
If we look at
SAND in a medium-long term, we cannot rule out a big picture as shown on weekly chart. The big signal of Price Action will be the Neckline achievement (shown on chart as wave IV retest) of a large "Head & Shoulders". Working on daily time frame, I found some interesting resistance levels, useful for evaluating the strength of the trend, step by step.I came up with this idea thanks to our last trade on Sandbox, which developed a potential bullish impulse structure.
(Click and Play on Chart below)
If there are conditions, I will update this idea below.
...trade with care! 👍
Cheers!
If you think that my analysis is useful, please...
"Like, Share and Comment" ...thank you! 💖
注释
DAILY CHART注释

相关出版物
免责声明
这些信息和出版物并非旨在提供,也不构成TradingView提供或认可的任何形式的财务、投资、交易或其他类型的建议或推荐。请阅读使用条款了解更多信息。