
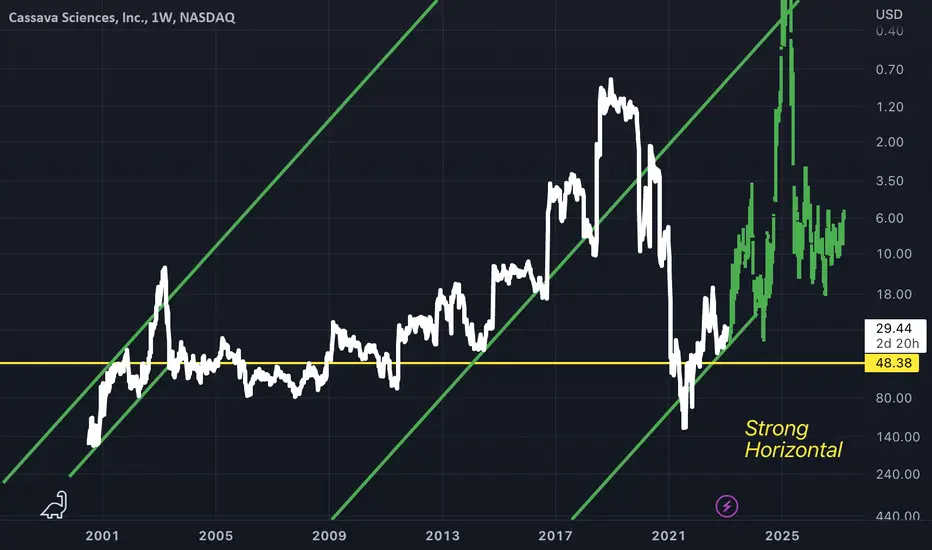
Slanted Double Bottom
This can be also observed earlier in prices history, again along the strong horizontal in yellow which is the most important take away from this chart
Bars pattern placed in green is just an example of how price could recover
Bullish above the horizontal
This can be also observed earlier in prices history, again along the strong horizontal in yellow which is the most important take away from this chart
Bars pattern placed in green is just an example of how price could recover
Bullish above the horizontal

免责声明
这些信息和出版物并非旨在提供,也不构成TradingView提供或认可的任何形式的财务、投资、交易或其他类型的建议或推荐。请阅读使用条款了解更多信息。