做多
Siacoin Double Bottom
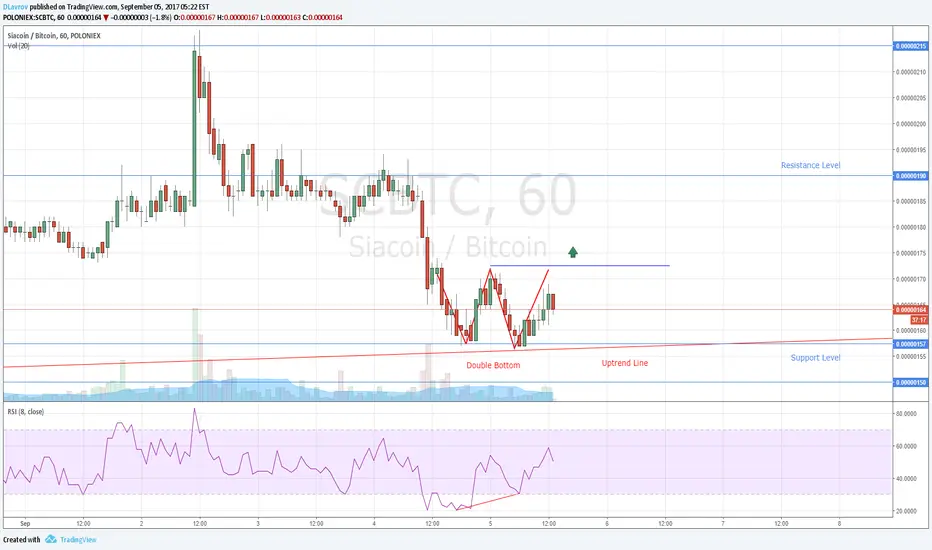
The market gives us a new buy opportunity. Let's look at the 1H chart of Siacoin. We can see that the price bounced from the support zone formed by the main uptrend line and 0.00000157 support level. The double bottom chart pattern gives us a trend reversal signal. Also a bullish divergence, formed by the price and RSI, confirms that the market is going to move upward. We should be ready to catch this possible price movement. Pending orders for buy must be placed above the local swing high at 0.00000173 level. Stop orders must be below the support zone at 0.00000155 level. The main profit target should be at 0.00000190 level and other part of trading volume can be closed at 0.00000215 level. If the market drops below the uptrend line, the buy orders must be deleted.

💰COPY MY TRADES FOR FREE! Join 👉 bit.ly/41DKDBD
📣 Get Welcome Bonuses for 1st Trade 👉 bit.ly/bonus_bybit
💎 Share My BEST Trades here 👉 bit.ly/wubits
📣 Get Welcome Bonuses for 1st Trade 👉 bit.ly/bonus_bybit
💎 Share My BEST Trades here 👉 bit.ly/wubits
免责声明
这些信息和出版物并非旨在提供,也不构成TradingView提供或认可的任何形式的财务、投资、交易或其他类型的建议或推荐。请阅读使用条款了解更多信息。