
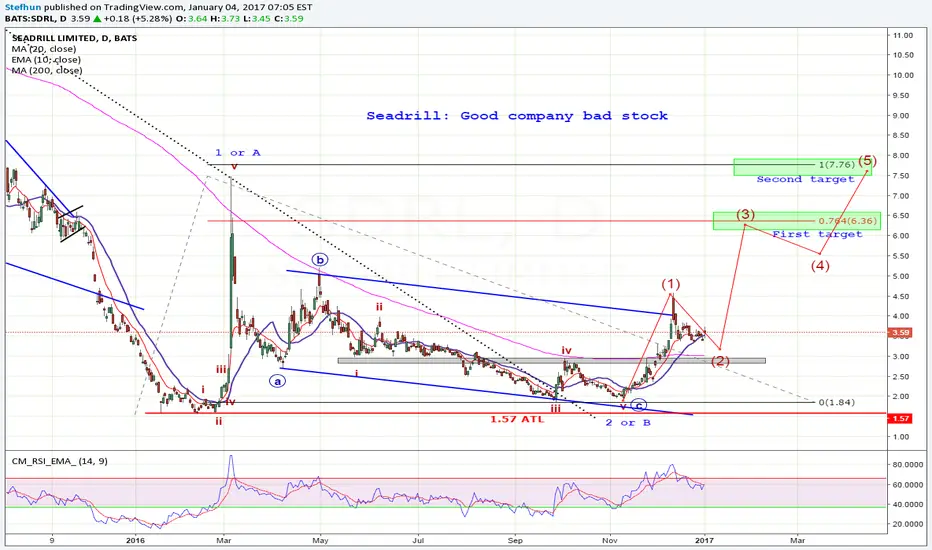
Stock went down from very high price to $1.57. Consolidation in progress.
This chart show that a good company can have a bad stock... I think this is a corrective movement after hit the $1.57 ATL
Flat to the upside... so, I do give a bigger probability to the ABC correction rather than impusle wave.
This is a daily chart but count based on weekly. Let's see how it will develop...

免责声明
这些信息和出版物并非旨在提供,也不构成TradingView提供或认可的任何形式的财务、投资、交易或其他类型的建议或推荐。请阅读使用条款了解更多信息。