
Trade Bias: Long
Chart Analysis:
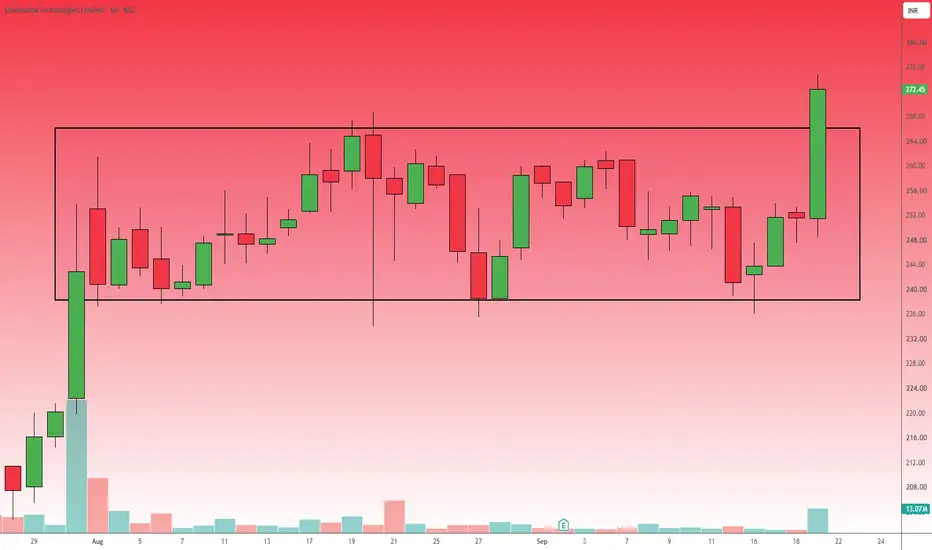
As observed in Shadowfax Technologies has spent several weeks consolidating within a clear rectangular channel, bounded by support around 240.00 and resistance near 264.00.
The most recent daily price action demonstrates a definitive breakout above this resistance zone, printing a strong, full-bodied bullish candle that closed at 272.45 (+8.31%).
To satisfy the requirement of multiple technical confirmations, this pattern breakout is heavily supported by a massive volume spike (13.07M).
The combination of a structural resistance breach and unusually high buying volume suggests strong underlying momentum.
Trade Parameters:
Entry Point: Current market price near 272.45 is viable for momentum traders.
Alternatively, conservative traders can look for a slight pullback to the 264.00 level, which should now act as flipped support.
Target : 288.00 – 295.00.
The primary target is calculated using the measured move technique: taking the height of the consolidation box (24 points) and projecting it upward from the 264.00 breakout level.
Stop Loss: 255.00.
Placing a stop loss below the midpoint of the breakout candle protects capital in the event of a false breakout or "bull trap".
Estimated Horizon: Short to medium term (1 to 4 weeks).
Chart Analysis:
As observed in Shadowfax Technologies has spent several weeks consolidating within a clear rectangular channel, bounded by support around 240.00 and resistance near 264.00.
The most recent daily price action demonstrates a definitive breakout above this resistance zone, printing a strong, full-bodied bullish candle that closed at 272.45 (+8.31%).
To satisfy the requirement of multiple technical confirmations, this pattern breakout is heavily supported by a massive volume spike (13.07M).
The combination of a structural resistance breach and unusually high buying volume suggests strong underlying momentum.
Trade Parameters:
Entry Point: Current market price near 272.45 is viable for momentum traders.
Alternatively, conservative traders can look for a slight pullback to the 264.00 level, which should now act as flipped support.
Target : 288.00 – 295.00.
The primary target is calculated using the measured move technique: taking the height of the consolidation box (24 points) and projecting it upward from the 264.00 breakout level.
Stop Loss: 255.00.
Placing a stop loss below the midpoint of the breakout candle protects capital in the event of a false breakout or "bull trap".
Estimated Horizon: Short to medium term (1 to 4 weeks).

免责声明
这些信息和出版物并非旨在提供,也不构成TradingView提供或认可的任何形式的财务、投资、交易或其他类型的建议或推荐。请阅读使用条款了解更多信息。
免责声明
这些信息和出版物并非旨在提供,也不构成TradingView提供或认可的任何形式的财务、投资、交易或其他类型的建议或推荐。请阅读使用条款了解更多信息。