
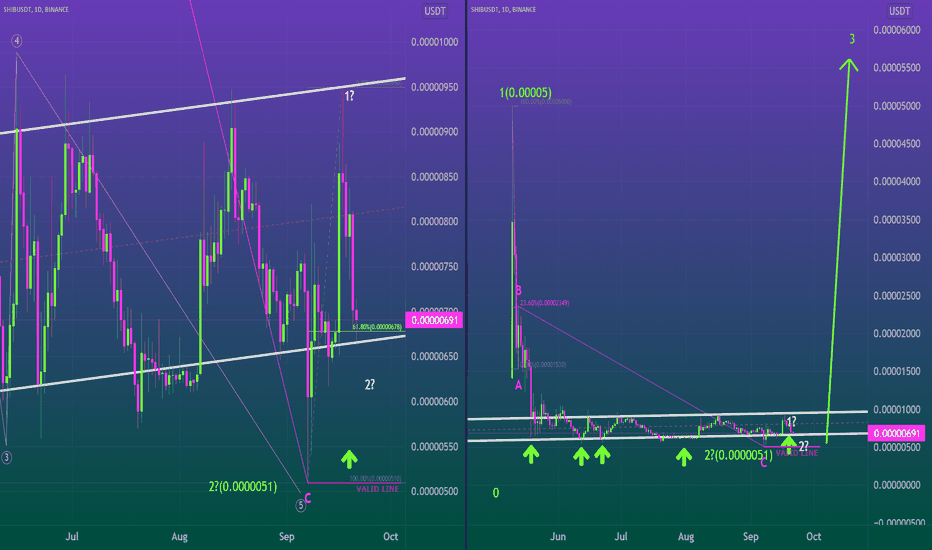
✅PREVIOUSLY ON SHIBUSDT
If A is at 0.0000153 and B is at 0.00002357, there must be the 5 waves after B to form C.
The 5 waves can be counted after B and 0.00000510 could be C.
This is how we expected the bullish impulse(3rd wave) from 0.00000678
*Normally, the 3rd wave tends to be stronger than other impulses.
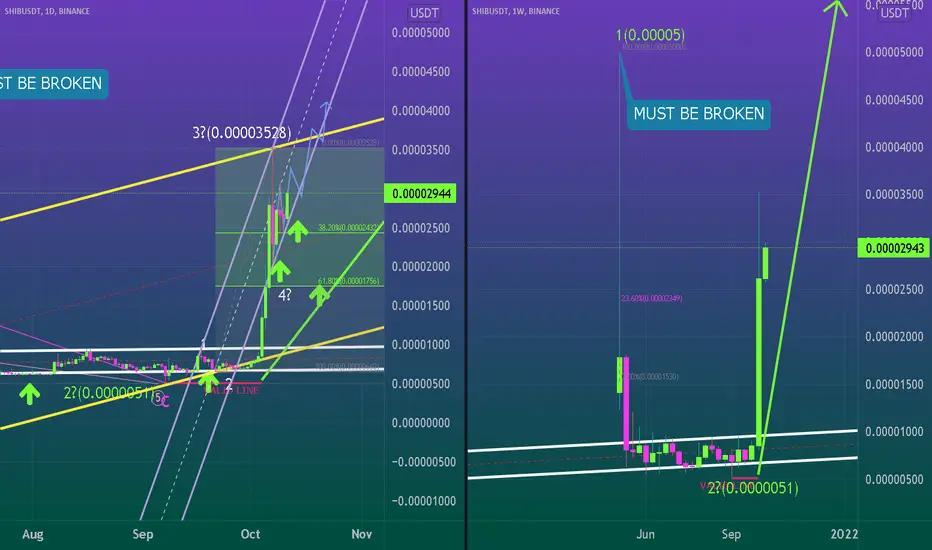
✅ WHERE WE ARE
0.00003528 can be thought as 3(white).
If 0.0002058 is 4(white) and we are on the 5th wave, 0.00005 must be broken to make 3(lime).
If you only looking at Daily chart, it's normal to count that way.
However, once you care about Weekly chart, you can see we could be still on the strong 3rd wave.
So as one of the ideas, we can see the current waves on Daily bullish as long as Weekly candles keep bullish.
Counting on Daily chart should be corrected in accordance with Weekly chart to establish consistency.
I'll adjust counting in near future.
↘️5waves(impulse)
A...0.00001530(BUY)
↗️3waves(correction)
B...0.00002357(SELL)
↘️5waves(impulse)
C=0...0.00000510(BUY)
↗️5waves(impulse)
1...0.0000095(SELL)
↘️3wave(correction)
2...0.0000066(BUY)
↗️5waves(impulse)
3...0.0003528(SELL)
↘️1wave?(correction)*Rule of alternation
4...0.0002058?<-We should recognize this to buy.
↗️5waves(impulse)
5...*(SELL)
*As long as 0.0000051 remains unbroken, this idea is valid.
💡The absolute principle for trading💡
BUY - as low as possible
SELL - as high as possible
PLEASE DO NOT FORGET TO SMASH LIKE👍🏻 AND FOLLOW ME❤ IT MOTIVATES ME TO THE NEXT IDEA! THANK YOU 🎉
If A is at 0.0000153 and B is at 0.00002357, there must be the 5 waves after B to form C.
The 5 waves can be counted after B and 0.00000510 could be C.
This is how we expected the bullish impulse(3rd wave) from 0.00000678
*Normally, the 3rd wave tends to be stronger than other impulses.
✅ WHERE WE ARE
0.00003528 can be thought as 3(white).
If 0.0002058 is 4(white) and we are on the 5th wave, 0.00005 must be broken to make 3(lime).
If you only looking at Daily chart, it's normal to count that way.
However, once you care about Weekly chart, you can see we could be still on the strong 3rd wave.
So as one of the ideas, we can see the current waves on Daily bullish as long as Weekly candles keep bullish.
Counting on Daily chart should be corrected in accordance with Weekly chart to establish consistency.
I'll adjust counting in near future.
↘️5waves(impulse)
A...0.00001530(BUY)
↗️3waves(correction)
B...0.00002357(SELL)
↘️5waves(impulse)
C=0...0.00000510(BUY)
↗️5waves(impulse)
1...0.0000095(SELL)
↘️3wave(correction)
2...0.0000066(BUY)
↗️5waves(impulse)
3...0.0003528(SELL)
↘️1wave?(correction)*Rule of alternation
4...0.0002058?<-We should recognize this to buy.
↗️5waves(impulse)
5...*(SELL)
*As long as 0.0000051 remains unbroken, this idea is valid.
💡The absolute principle for trading💡
BUY - as low as possible
SELL - as high as possible
PLEASE DO NOT FORGET TO SMASH LIKE👍🏻 AND FOLLOW ME❤ IT MOTIVATES ME TO THE NEXT IDEA! THANK YOU 🎉
注释
Weekly candles have kept bullish.
相关出版物
免责声明
这些信息和出版物并非旨在提供,也不构成TradingView提供或认可的任何形式的财务、投资、交易或其他类型的建议或推荐。请阅读使用条款了解更多信息。