
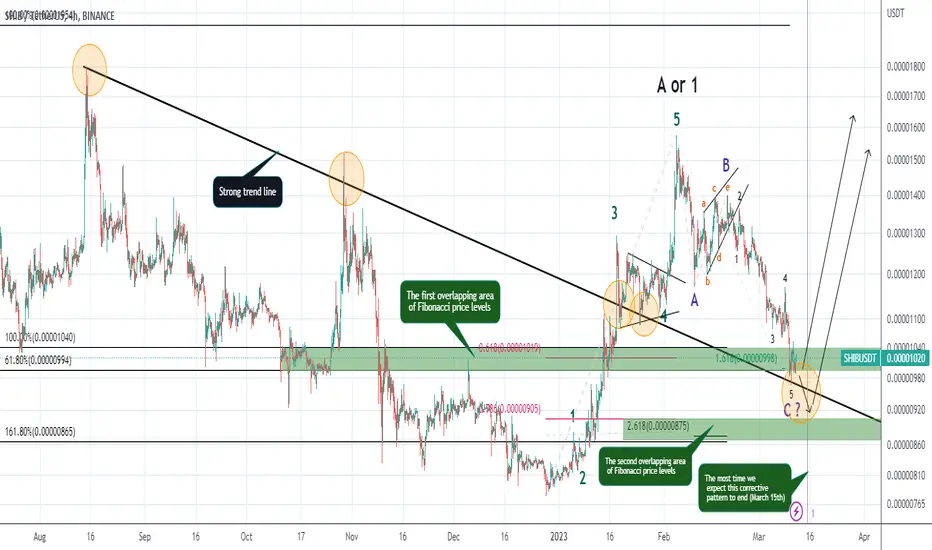
According to the price chart, it is "probably" at the end of wave C of the corrective pattern. I have identified two areas of overlapping Fibonacci price levels (green areas) where the price will probably start its bullish rally in one of these two areas. At this moment, according to the pattern of the chart and the fact that the price is in the first overlapping area, we can consider the price correction to be over. But if the price correction continues, I expect that the price will be in the second green area and at the latest on March 15th (on this day, the correction pattern has continued to correct itself for the duration of the upward wave (i.e. wave A or 1), and I consider this to be the maximum time for an ABC corrective pattern to complete) to complete the corrective pattern and start its bullish rally.
.
.
.
And I consider the main price targets in the Fibonacci extension of 100%, 162% and 262% of wave A or 1 from the bottom of the corrective pattern. which are at the prices of $0.000019, $0.000030, and $0.00006, respectively.
.
.
.
And I consider the main price targets in the Fibonacci extension of 100%, 162% and 262% of wave A or 1 from the bottom of the corrective pattern. which are at the prices of $0.000019, $0.000030, and $0.00006, respectively.

免责声明
这些信息和出版物并非旨在提供,也不构成TradingView提供或认可的任何形式的财务、投资、交易或其他类型的建议或推荐。请阅读使用条款了解更多信息。
免责声明
这些信息和出版物并非旨在提供,也不构成TradingView提供或认可的任何形式的财务、投资、交易或其他类型的建议或推荐。请阅读使用条款了解更多信息。