
Hello everyone,
Please take a look at the SHIB / USDT chart on the 1D interval.
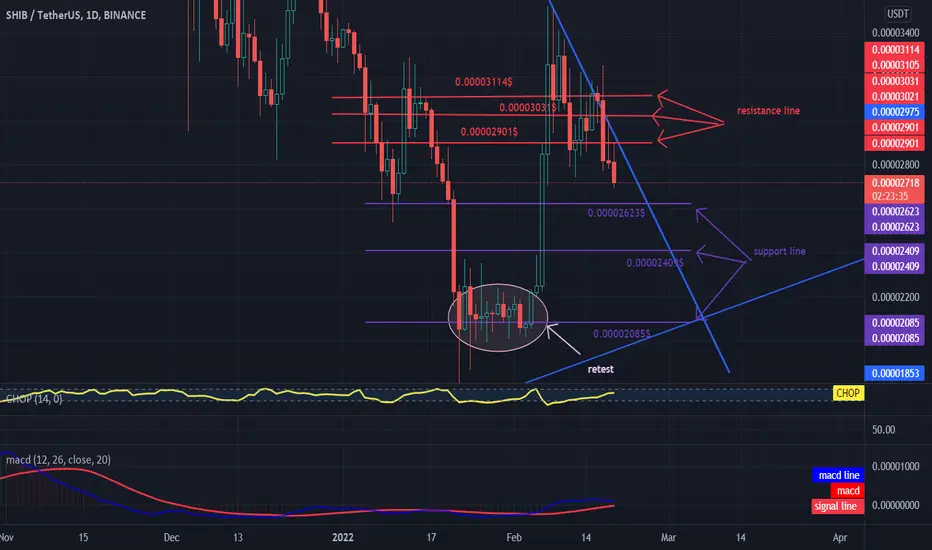
We see that the price is just below the downtrend line and we are approaching the exit from the triangle.
It is worth paying attention to the CHOP indicator which shows an increase in energy for the upcoming moves. And the MACD indicator where the blue line is still above the red one, which may confirm the continuation of the local uptrend.
Let's move on to determining the support points for the price, as you can see the first support is at $ 0.00002623, and the next support at $ 0.00002409, $ 0.00002085.
Looking the other way, we have marked the points of resistance that the price will most likely meet on its way before the increases. The first resistance occurs at $ 0.00002901, the second at $ 0.00003031, and the third at $ 0.00003114.
Please take a look at the SHIB / USDT chart on the 1D interval.
We see that the price is just below the downtrend line and we are approaching the exit from the triangle.
It is worth paying attention to the CHOP indicator which shows an increase in energy for the upcoming moves. And the MACD indicator where the blue line is still above the red one, which may confirm the continuation of the local uptrend.
Let's move on to determining the support points for the price, as you can see the first support is at $ 0.00002623, and the next support at $ 0.00002409, $ 0.00002085.
Looking the other way, we have marked the points of resistance that the price will most likely meet on its way before the increases. The first resistance occurs at $ 0.00002901, the second at $ 0.00003031, and the third at $ 0.00003114.

免责声明
这些信息和出版物并非旨在提供,也不构成TradingView提供或认可的任何形式的财务、投资、交易或其他类型的建议或推荐。请阅读使用条款了解更多信息。
免责声明
这些信息和出版物并非旨在提供,也不构成TradingView提供或认可的任何形式的财务、投资、交易或其他类型的建议或推荐。请阅读使用条款了解更多信息。