
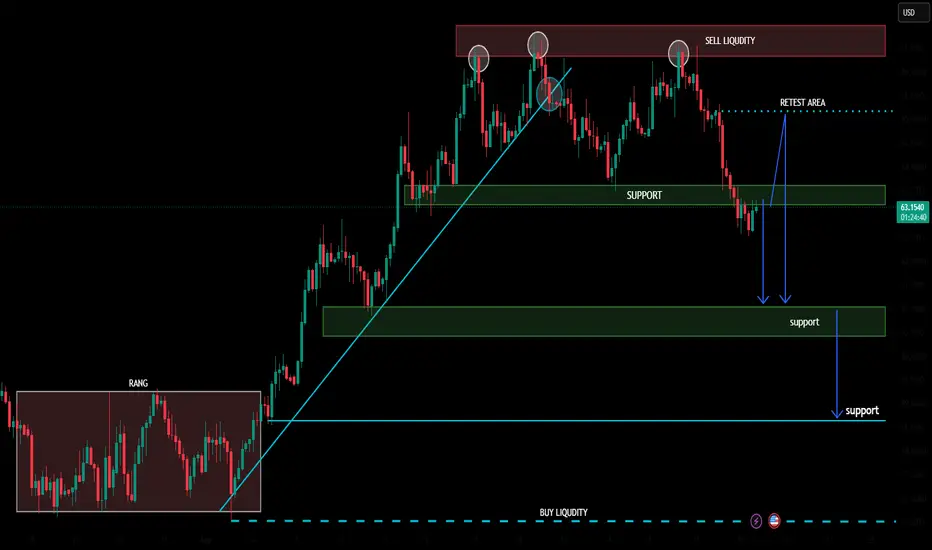
Technical Analysis | Retest & Key Targets 📊
Price is currently around 63.22 and has pulled back into the marked support zone after rejecting the sell-liquidity area near the recent highs.
📌 Resistance / Retest Area
• 65.00–65.20 — key retest zone
• 66.20–66.60 — major resistance / sell-liquidity zone
📌 Support Levels
• S1: 63.00–63.50
• S2: 60.50–61.00
• S3: 58.60–58.80
• Major lower liquidity: ~56.60
🎯 Bullish Targets
If the current support holds and price reclaims 65.00–65.20:
• Target 1: 65.20
• Target 2: 66.20
• Target 3: 66.50–66.60 🎯
📉 Bearish Scenario
If price loses the 63.00–63.50 support zone, the next marked levels become:
• Target 1: 61.00
• Target 2: 60.50
• Target 3: 58.60–58.80 🎯
📊 Technical View
The chart shows a pullback from the upper sell-liquidity zone into support. The 63.00–63.50 area is the key decision zone. A successful hold and reclaim of 65.00–65.20 would favor a move back toward the upper liquidity area, while a confirmed breakdown below support could expose the lower support zones.
⚠️ Risk Management
This is chart-based technical analysis and represents potential scenarios, not guaranteed results or financial advice. Wait for confirmation and manage risk according to your own strategy.
交易开始
ACTIVE NOW 
相关出版物
免责声明
这些信息和出版物并非旨在提供,也不构成TradingView提供或认可的任何形式的财务、投资、交易或其他类型的建议或推荐。请阅读使用条款了解更多信息。