
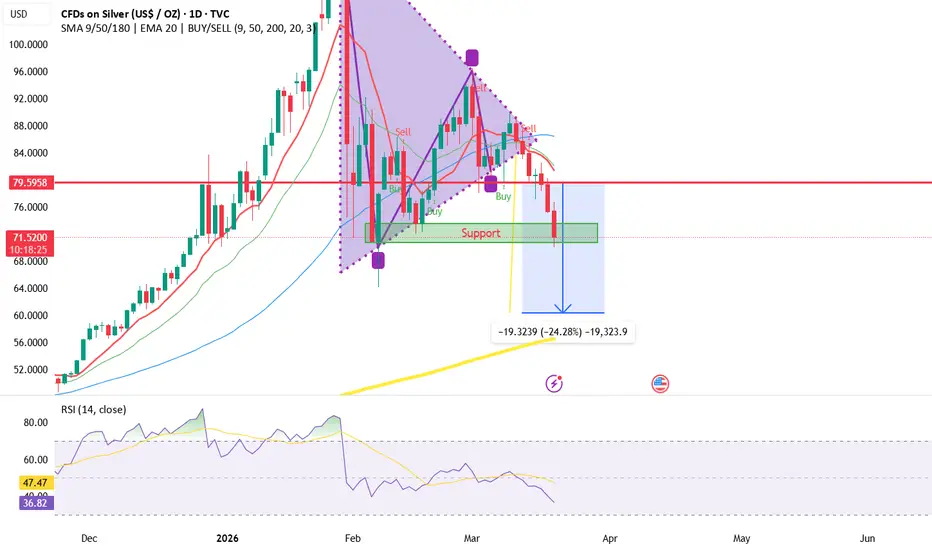
Silver has continued to drop after breaking the wedge formation with a lot of strength but is currently bouncing on support level in the $70 price point.
The RSI currently shows more room to the down side since it has not yet reached the 30 and
hitting the price point target is looking very likely to follow through.
The 200 Week Moving Average which is the yellow SMA line in the bottom of the chart is a strong resistance level which I believe is pulling the candles to it like gravity is most likely to hold if we break the support level in the $70 price point. This level also matches the downside measured move I drew with the original breakout also adding more validity to the projection.
The bounce off the 200 Week moving average will more than likely be be a strong bounce upward due to the RSI reaching oversold territory when reached.

免责声明
这些信息和出版物并非旨在提供,也不构成TradingView提供或认可的任何形式的财务、投资、交易或其他类型的建议或推荐。请阅读使用条款了解更多信息。