
SKPC Retest & Rebound Zone 🧪📉✨
I am tracking Sidi Kerir Petrochemicals (SKPC) as it approaches a high-confluence support zone. After a period of correction, the stock is nearing a level where the "big money" 🏛️💸
typically steps back in.
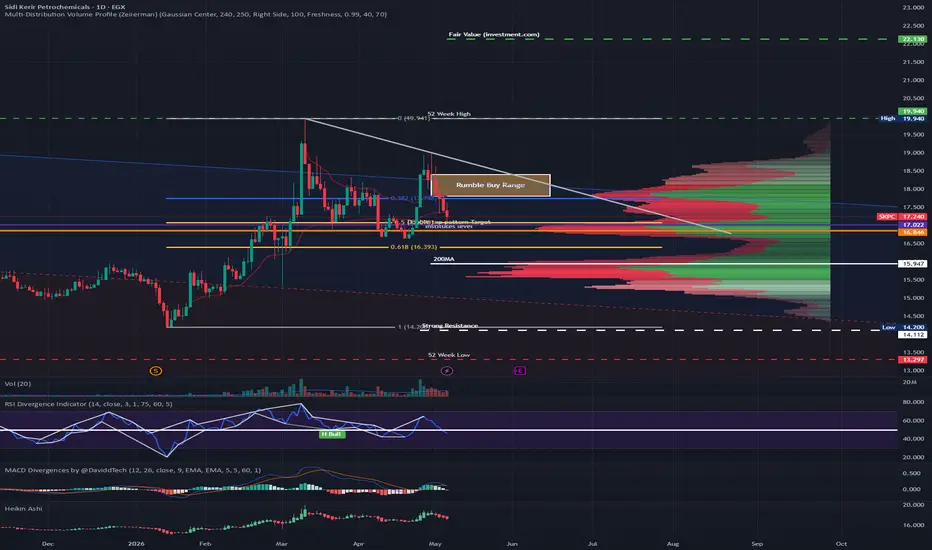
The Double Top & Fib Alignment: The stock is currently fulfilling the technical target of a Double Top pattern. 📉🚩
This move aligns perfectly with the 50% Fibonacci level measured from the last major bottom to the All-Time High (ATH).
This level has historically acted as a strong "springboard" for the price. 🏹🎯
Support & Liquidity: The 17.00 EGP level is more than just a number; it sits directly atop a major structural support floor. 🧱⚓
I am seeing significant liquidity clusters sitting just below this level, suggesting that institutional buy orders are likely waiting to absorb the selling pressure. 🛒🔥
Volume & VWAP: Price action is currently trading below the Anchored VWAP from the last major dip, indicating an "oversold" state relative to the average weighted price. 📊📉
Crucially, volume has been decreasing every day last week this "drying up" of selling pressure is a classic sign that the bears are exhausted and a reversal is brewing. 🛑⛽
The Strategy: Eyes on 17.00 EGP. 🔍👀
If we see a bullish reversal candle (like a hammer or engulfing pattern) on rising volume at this level, it confirms the rebound.
This is a high-probability "buy the dip" zone for those looking for a move back toward the 20.00+ levels. 🧘♂️🎯💎
If you like my insights, please follow and boost 🙌💙🚀
🎁 Get a $15 discount on your next subscription:
🔗 tradingview.com/pricing/?share_your_love=mnmabroukw36ix ✨💸🤑
I am tracking Sidi Kerir Petrochemicals (SKPC) as it approaches a high-confluence support zone. After a period of correction, the stock is nearing a level where the "big money" 🏛️💸
typically steps back in.
The Double Top & Fib Alignment: The stock is currently fulfilling the technical target of a Double Top pattern. 📉🚩
This move aligns perfectly with the 50% Fibonacci level measured from the last major bottom to the All-Time High (ATH).
This level has historically acted as a strong "springboard" for the price. 🏹🎯
Support & Liquidity: The 17.00 EGP level is more than just a number; it sits directly atop a major structural support floor. 🧱⚓
I am seeing significant liquidity clusters sitting just below this level, suggesting that institutional buy orders are likely waiting to absorb the selling pressure. 🛒🔥
Volume & VWAP: Price action is currently trading below the Anchored VWAP from the last major dip, indicating an "oversold" state relative to the average weighted price. 📊📉
Crucially, volume has been decreasing every day last week this "drying up" of selling pressure is a classic sign that the bears are exhausted and a reversal is brewing. 🛑⛽
The Strategy: Eyes on 17.00 EGP. 🔍👀
If we see a bullish reversal candle (like a hammer or engulfing pattern) on rising volume at this level, it confirms the rebound.
This is a high-probability "buy the dip" zone for those looking for a move back toward the 20.00+ levels. 🧘♂️🎯💎
If you like my insights, please follow and boost 🙌💙🚀
🎁 Get a $15 discount on your next subscription:
🔗 tradingview.com/pricing/?share_your_love=mnmabroukw36ix ✨💸🤑

免责声明
这些信息和出版物并非旨在提供,也不构成TradingView提供或认可的任何形式的财务、投资、交易或其他类型的建议或推荐。请阅读使用条款了解更多信息。