
If you're here it probably means you do just like me.
So here's what I've dug out,
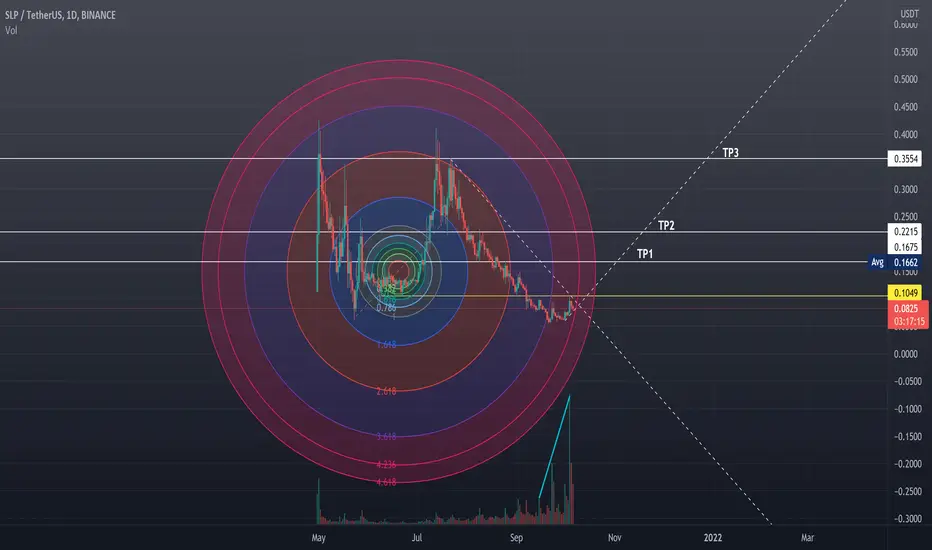
first look at the volume at the bottom of the chart
Second the chart seems to indicate that a REALLY insane pump will take place right around the corner if it successfully holds the current trend for 3-4 days.
thirdly, the chart simply looks like a giga double bottom forming.
and lastly, there's the Fib 4.236 looking primed up for a price increase.
**DYOR** This chart is only one data point and my personal forecast based on what I see, don't make an investment based only on this chart.

免责声明
这些信息和出版物并非旨在提供,也不构成TradingView提供或认可的任何形式的财务、投资、交易或其他类型的建议或推荐。请阅读使用条款了解更多信息。
免责声明
这些信息和出版物并非旨在提供,也不构成TradingView提供或认可的任何形式的财务、投资、交易或其他类型的建议或推荐。请阅读使用条款了解更多信息。