
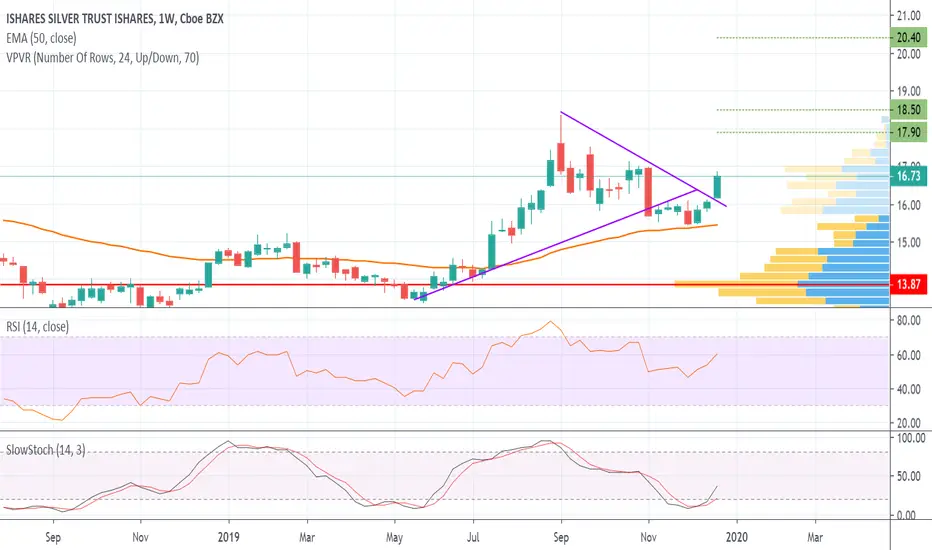
The weekly chart for the iShares Silver ETF shows how it has been pulling back from its recent highs back in early September. The stock broke down in early November but was able to find support along the 50-day EMA line. It has managed to break out again this week as it nears volume levels that will not be able to hold much resistance against the price. Continued strength in price should help a Golden Cross occur to confirm the bullish strength behind this commodity.
I would like to see this ETF clear $17.10 just so it gets above and holds that last volume level but definitely looking promising. My potential price targets are noted.
I would like to see this ETF clear $17.10 just so it gets above and holds that last volume level but definitely looking promising. My potential price targets are noted.

免责声明
这些信息和出版物并非旨在提供,也不构成TradingView提供或认可的任何形式的财务、投资、交易或其他类型的建议或推荐。请阅读使用条款了解更多信息。
免责声明
这些信息和出版物并非旨在提供,也不构成TradingView提供或认可的任何形式的财务、投资、交易或其他类型的建议或推荐。请阅读使用条款了解更多信息。