
Ho, this baby ar screaming to be shortened! :D
Take a look at W, H1 and yes D chart here.
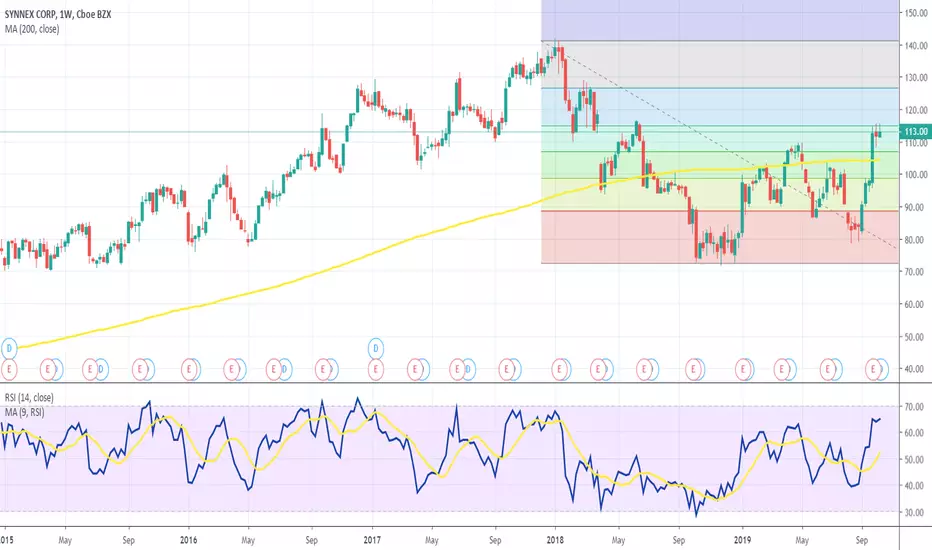
RSI is highly overbought, and value is floating in that area for some time, which is one of the clearest signals of possible price movement change.
Fibonacci on W time frame, 61.8 is to strong resistance level, for now.
My play is sell short with R/R 2:7
Take a look at W, H1 and yes D chart here.
RSI is highly overbought, and value is floating in that area for some time, which is one of the clearest signals of possible price movement change.
Fibonacci on W time frame, 61.8 is to strong resistance level, for now.
My play is sell short with R/R 2:7

免责声明
这些信息和出版物并非旨在提供,也不构成TradingView提供或认可的任何形式的财务、投资、交易或其他类型的建议或推荐。请阅读使用条款了解更多信息。
免责声明
这些信息和出版物并非旨在提供,也不构成TradingView提供或认可的任何形式的财务、投资、交易或其他类型的建议或推荐。请阅读使用条款了解更多信息。