
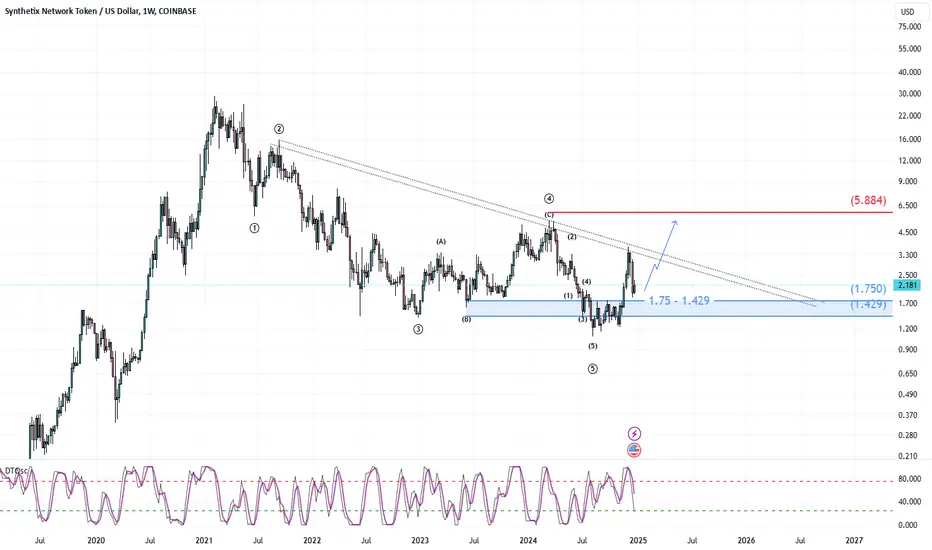
This analysis examines the price movement of Synthetix Network Token (SNX) on the weekly timeframe. The structure of the waves and key trendlines have been identified to help traders determine entry and exit points.
Key Highlights of the Analysis:
Strong Support Zone ($1.75–$1.429):
The price has recently reacted to a critical support zone between $1.75–$1.429, showing a strong rebound.
This zone is significant due to the completion of the fifth wave and its alignment with historical support levels, making it a crucial entry point for buyers.
Descending Trendline:
The price remains under the influence of a long-term descending trendline that has capped further upside movement.
Breaking above this trendline and holding above $2.5 could signal the beginning of a new bullish trend.
Key Resistance Level ($5.884):
The major resistance lies at $5.884, aligning with the peak of previous waves.
Reaching this level could serve as a medium-term target for buyers if the price successfully breaks the descending trendline.
Stochastic Oscillator:
The stochastic oscillator is moving toward the overbought region, suggesting a potential short-term correction.
However, further upward movement is possible, especially if the price consolidates above $2.5.
Potential Scenarios:
Bullish Scenario:
Breaking the descending trendline and surpassing the $2.5 resistance could push the price toward $5.884. This scenario is ideal for medium- to long-term traders.
Bearish Scenario:
If the price declines and retests the support zone at $1.75–$1.429, this area could provide another buying opportunity.
Breaking below this support zone could lead to further declines.
Conclusion:
With the technical structure and key levels outlined, Synthetix Network Token is at a critical juncture. Traders should closely monitor the price’s reaction to the descending trendline and the support zone.
Key Highlights of the Analysis:
Strong Support Zone ($1.75–$1.429):
The price has recently reacted to a critical support zone between $1.75–$1.429, showing a strong rebound.
This zone is significant due to the completion of the fifth wave and its alignment with historical support levels, making it a crucial entry point for buyers.
Descending Trendline:
The price remains under the influence of a long-term descending trendline that has capped further upside movement.
Breaking above this trendline and holding above $2.5 could signal the beginning of a new bullish trend.
Key Resistance Level ($5.884):
The major resistance lies at $5.884, aligning with the peak of previous waves.
Reaching this level could serve as a medium-term target for buyers if the price successfully breaks the descending trendline.
Stochastic Oscillator:
The stochastic oscillator is moving toward the overbought region, suggesting a potential short-term correction.
However, further upward movement is possible, especially if the price consolidates above $2.5.
Potential Scenarios:
Bullish Scenario:
Breaking the descending trendline and surpassing the $2.5 resistance could push the price toward $5.884. This scenario is ideal for medium- to long-term traders.
Bearish Scenario:
If the price declines and retests the support zone at $1.75–$1.429, this area could provide another buying opportunity.
Breaking below this support zone could lead to further declines.
Conclusion:
With the technical structure and key levels outlined, Synthetix Network Token is at a critical juncture. Traders should closely monitor the price’s reaction to the descending trendline and the support zone.
交易开始
The price has entered a very low-risk mid-term buying level.

免责声明
这些信息和出版物并非旨在提供,也不构成TradingView提供或认可的任何形式的财务、投资、交易或其他类型的建议或推荐。请阅读使用条款了解更多信息。
免责声明
这些信息和出版物并非旨在提供,也不构成TradingView提供或认可的任何形式的财务、投资、交易或其他类型的建议或推荐。请阅读使用条款了解更多信息。