
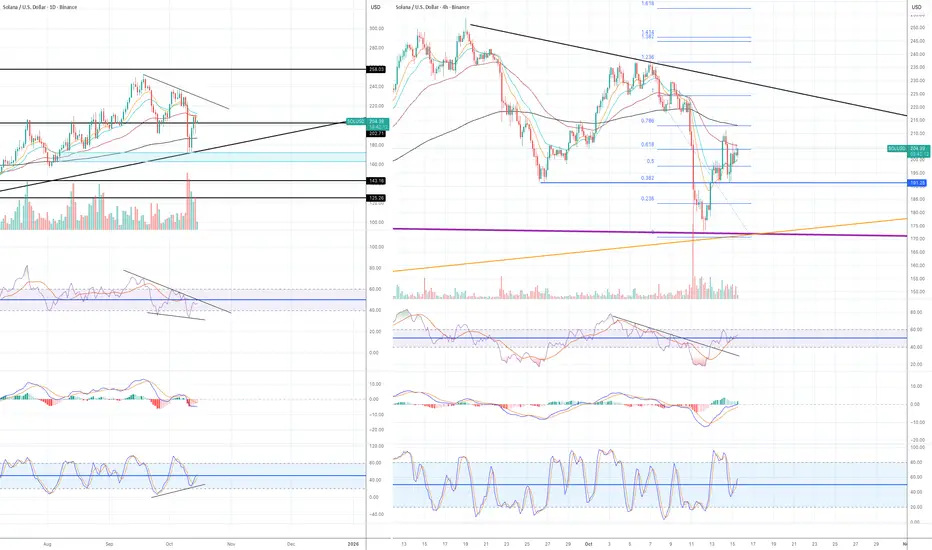
I opened a long position for a swing trade this morning.
A daily candle is still below EMA 12/21/55 and has not broken above the descending resistance line, however, I see a lot of bullish signs in the chart. I am cautiously optimistic, however, the bull is not in full control yet.
Daily:
Stochastic formed a clear positive divergence and is no in the bull zone.
RSI lines are trapped inside the descending triangle. The momentum is clearly building up and I am anticipating it to break to the upside given RSI line is starting to move to the upside and slow
MA (orange) line is also starting to tilt to the upside.
MACD lines are still in the bear zone, however, histogram shows the bearish momentum is weakening.
A daily candle is still below EMA 12/21/55, however, the price strongly held above the previous higher low at $190 (blue horizontal line) .
A daily candle is also above EMA200, two major support lines (purple and orange lines).
4H:
All three momentum indicators are in the bull zone now.
The price moved to the purple support line, moved up, retraced to retest Fib 0.382 level.
The price is above both EMA 12 and 21.
Trade plan:
Entry price: $202
S/L: $189
Target : $223
A daily candle is still below EMA 12/21/55 and has not broken above the descending resistance line, however, I see a lot of bullish signs in the chart. I am cautiously optimistic, however, the bull is not in full control yet.
Daily:
Stochastic formed a clear positive divergence and is no in the bull zone.
RSI lines are trapped inside the descending triangle. The momentum is clearly building up and I am anticipating it to break to the upside given RSI line is starting to move to the upside and slow
MA (orange) line is also starting to tilt to the upside.
MACD lines are still in the bear zone, however, histogram shows the bearish momentum is weakening.
A daily candle is still below EMA 12/21/55, however, the price strongly held above the previous higher low at $190 (blue horizontal line) .
A daily candle is also above EMA200, two major support lines (purple and orange lines).
4H:
All three momentum indicators are in the bull zone now.
The price moved to the purple support line, moved up, retraced to retest Fib 0.382 level.
The price is above both EMA 12 and 21.
Trade plan:
Entry price: $202
S/L: $189
Target : $223
交易手动结束
I just manually closed the account with a little but of profit. I am going to wait for a daily set up becomes more clear. It has been struggling to go above $211. So much selling pressure. Also, momentum and volatility are weakening. I will open a position when I can find a better set up in a daily chart. 
相关出版物
免责声明
这些信息和出版物并非旨在提供,也不构成TradingView提供或认可的任何形式的财务、投资、交易或其他类型的建议或推荐。请阅读使用条款了解更多信息。